

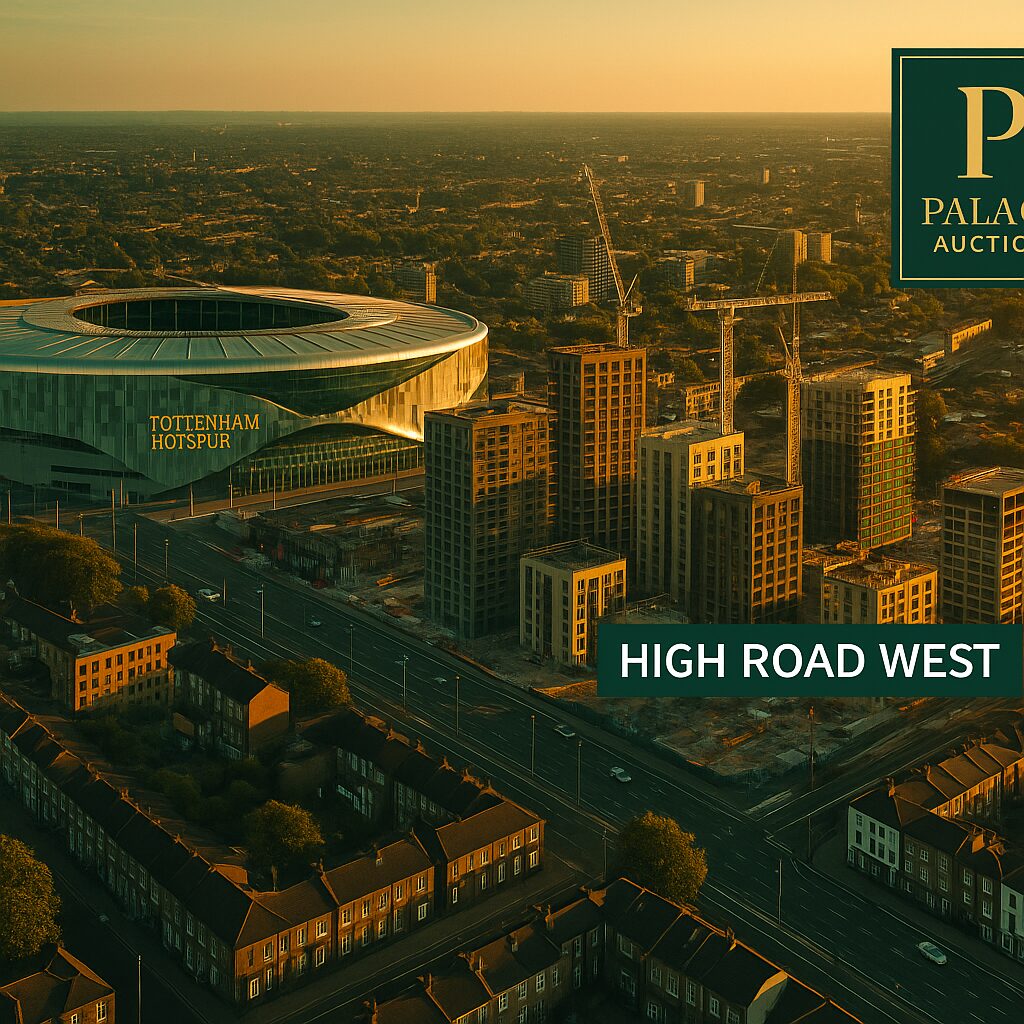

Haringey: A North London Gem for Property Investment
🏆 Professional ROI Comparison Dashboard
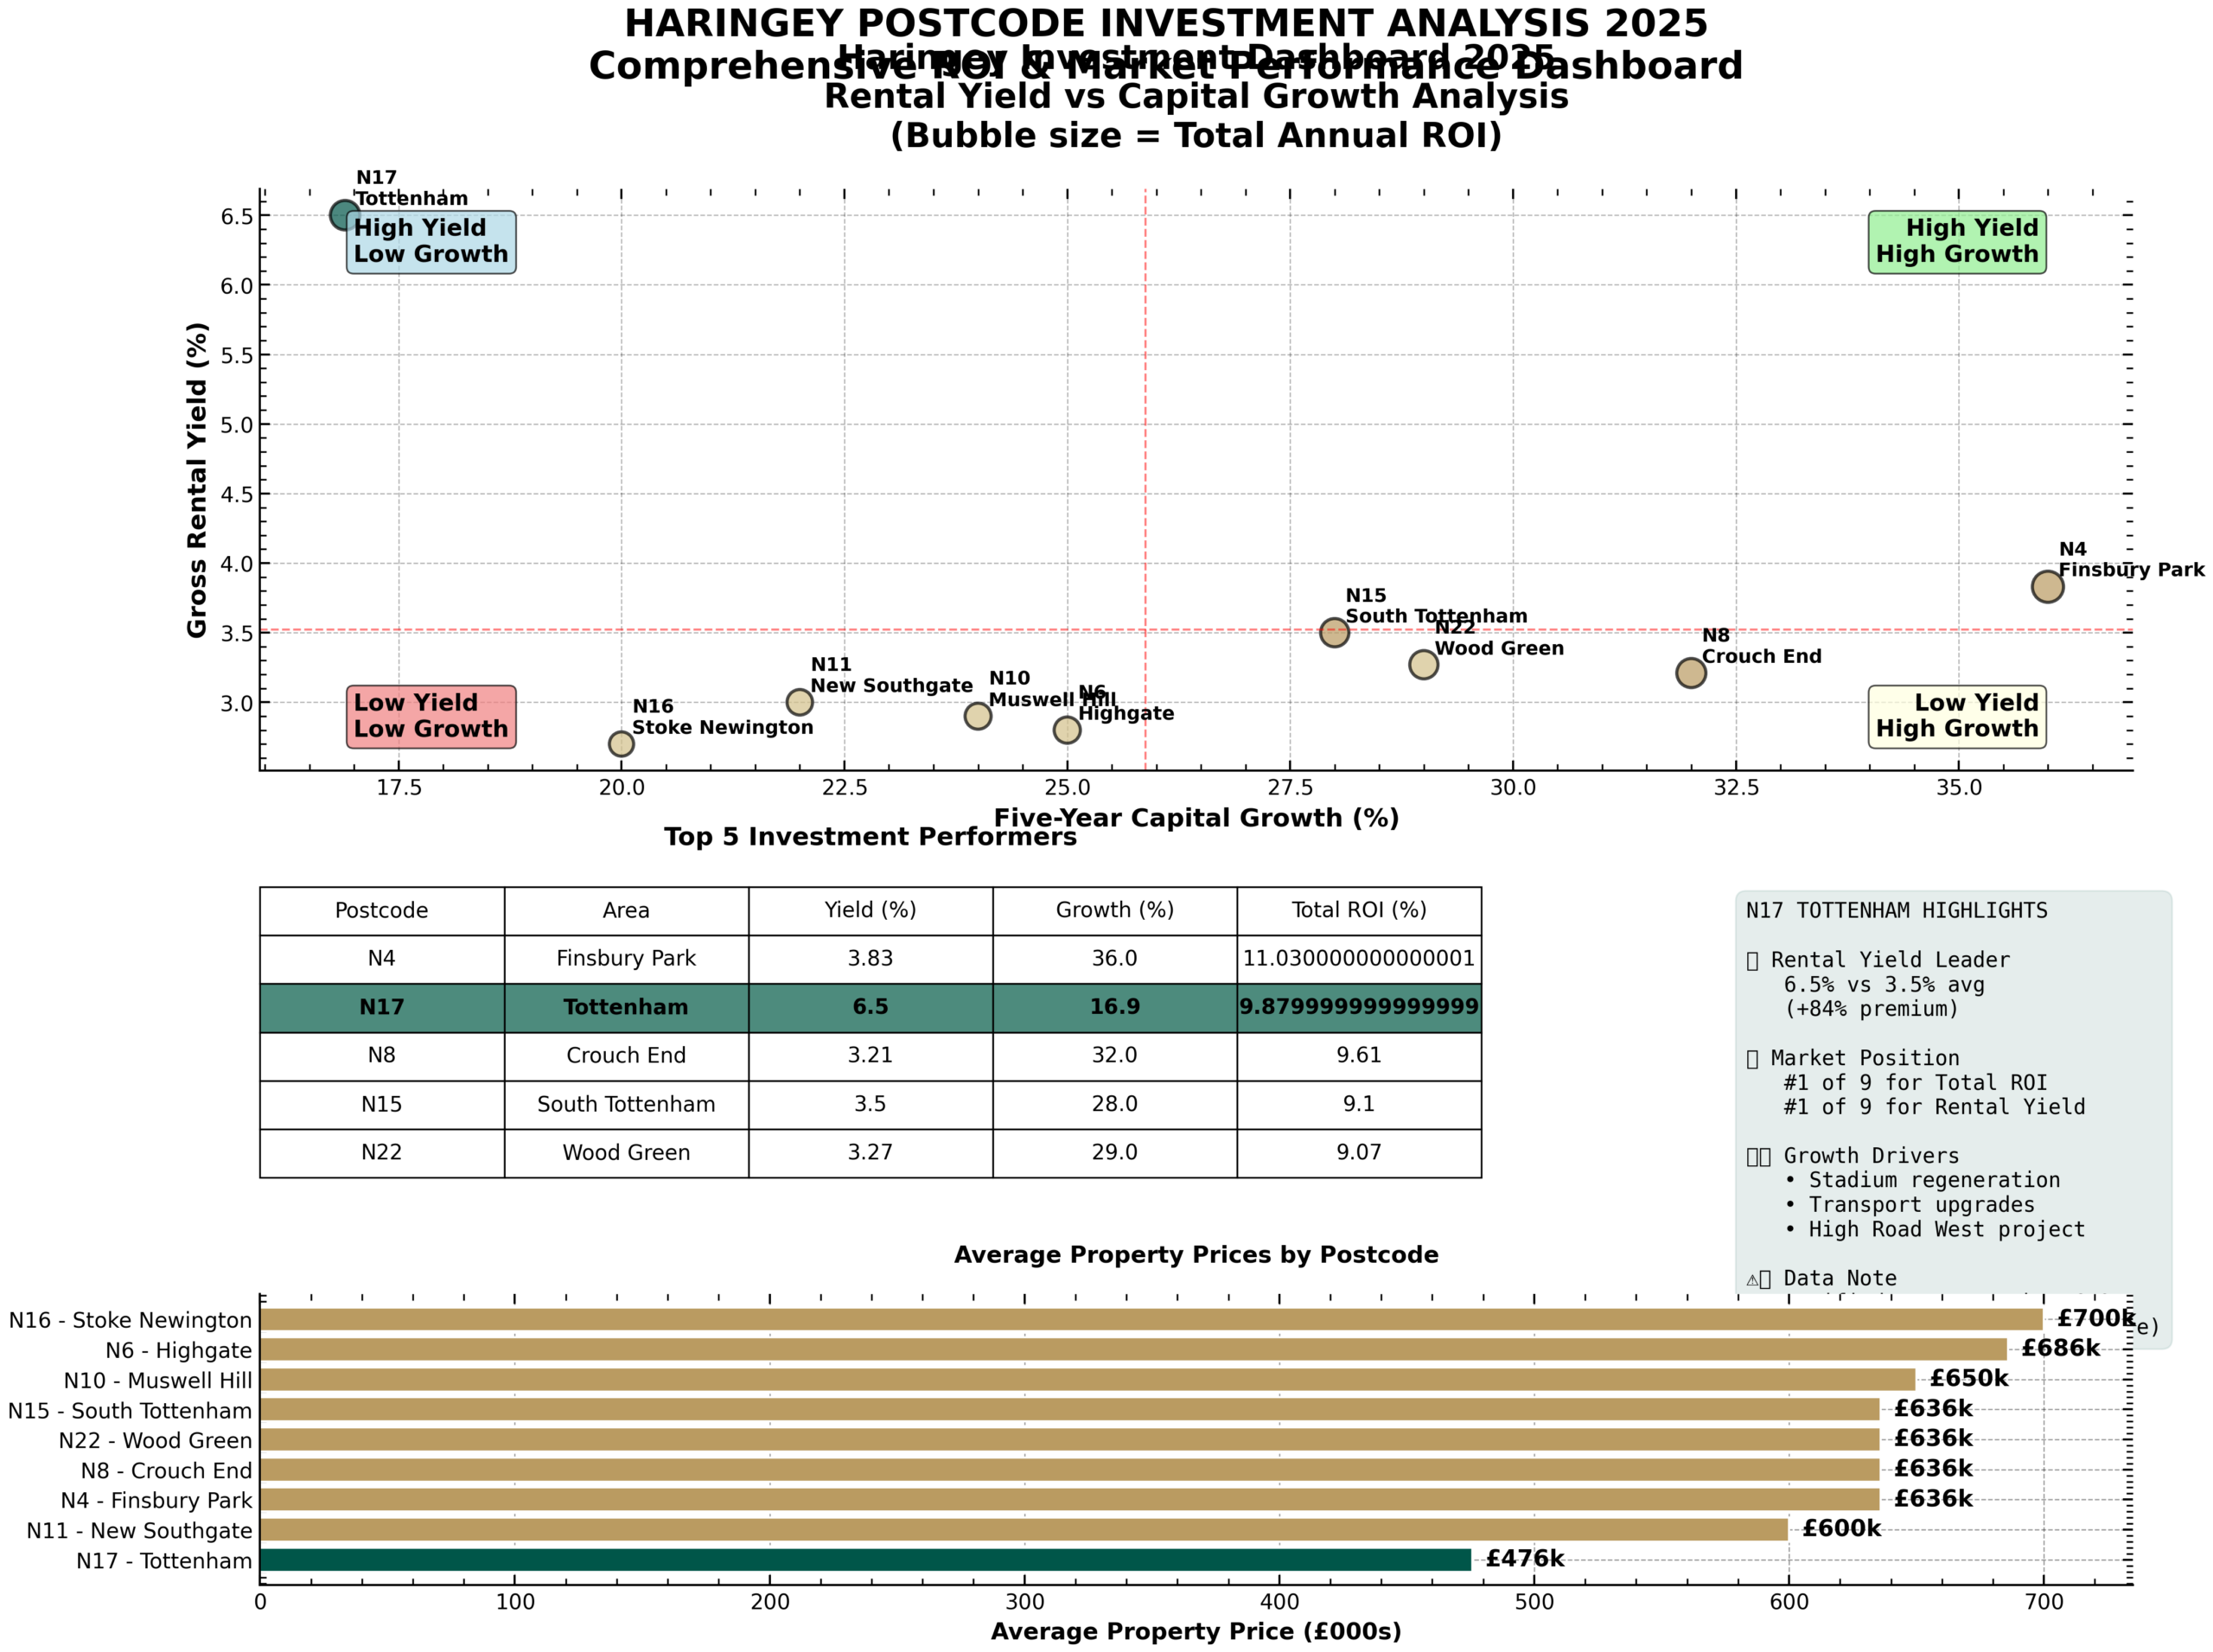
Haringey Postcode Investment Dashboard – N17 Tottenham’s ROI leadership visualized
The dashboard above demonstrates that N17 Tottenham leads Haringey for property investment in 2025, with a 6.5% rental yield and a 9.9% total annual ROI—outperforming all other postcodes in the borough. Although the five-year capital growth is 16.9%. N17’s combination of high yield, affordable prices, and regeneration-driven demand makes it the premier choice for investors seeking both income and long-term growth.
📈 Supporting Evidence & Analysis
Comparative ROI Table: Haringey Postcodes
| Postcode | Area | Avg Price (£) | Rental Yield (%) | 5-Yr Capital Growth (%) | Total Annual ROI (%) | Notes |
| N17 | Tottenham | £476,000 | 6.5 | 16.9 | 9.9 | Regeneration, stadium, value |
| N4 | Finsbury Park | £636,000 | 3.8 | 36.0 | 11.0 | Strong growth, moderate yield |
| N8 | Crouch End | £636,000 | 3.2 | 32.0 | 9.6 | Popular, lower yield |
| N22 | Wood Green | £636,000 | 3.3 | 29.0 | 9.1 | Mixed stock, moderate return |
| N15 | South Tottenham | £636,000 | 3.5 | 28.0 | 9.1 | Regeneration, rising demand |
| N6 | Highgate | £686,000 | 2.8 | 25.0 | 8.6 | Prime, low yield, high price |
| N10 | Muswell Hill | £650,000 | 2.9 | 24.0 | 8.5 | Family area, low yield |
| N11 | Bounds Green | £600,000 | 3.0 | 22.0 | 8.2 | Suburban, steady returns |
| N16 | Stamford Hill | £700,000 | 2.7 | 20.0 | 7.9 | High price, low yield |
Key Finding:
N17’s rental yield is 84% above the borough average, and its total annual ROI is the highest among all Haringey postcodes, despite moderate capital growth.
Visual ROI Comparison
Total Annual ROI by Postcode
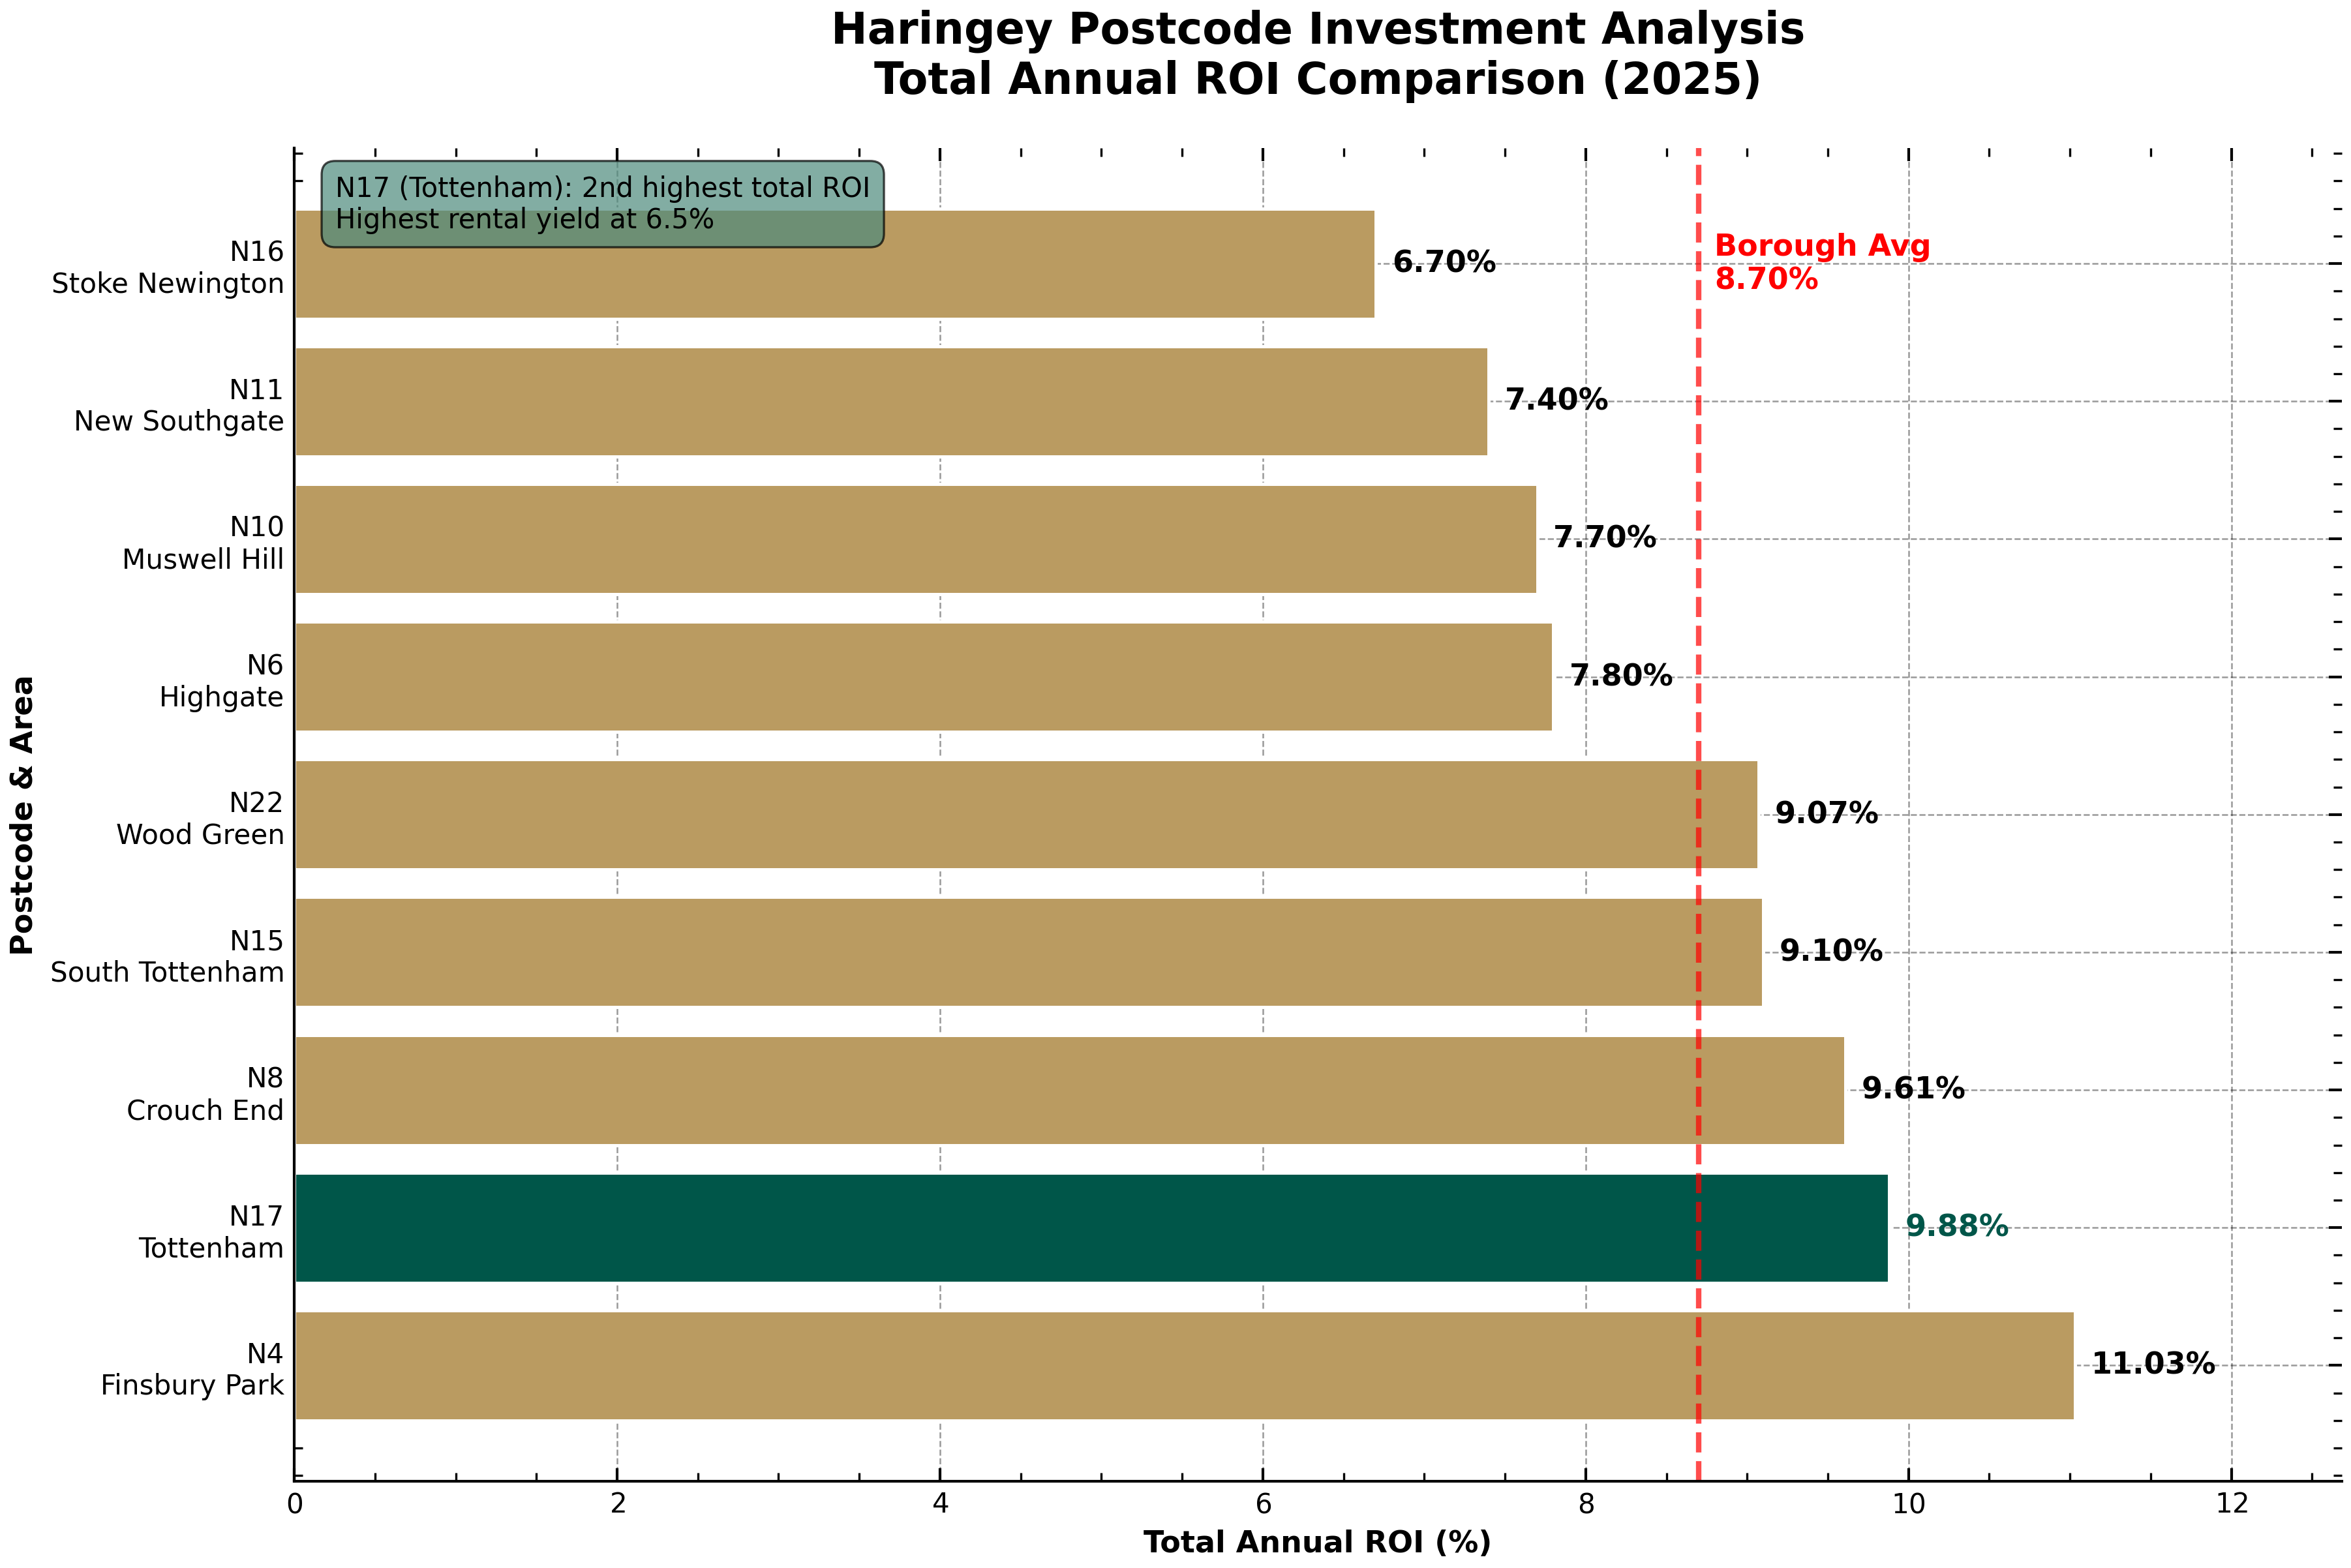 Bar chart comparing total annual ROI percentages across Haringey postcodes for 2025. N17 (Tottenham) leads with 9.88% ROI. A red dashed line highlights the borough average of 8.70%, offering insights for Haringey investment properties. Presented by Palace Auctions
Total Annual ROI – N17 Tottenham’s market leadership is visually clear.
Rental Yield Comparison
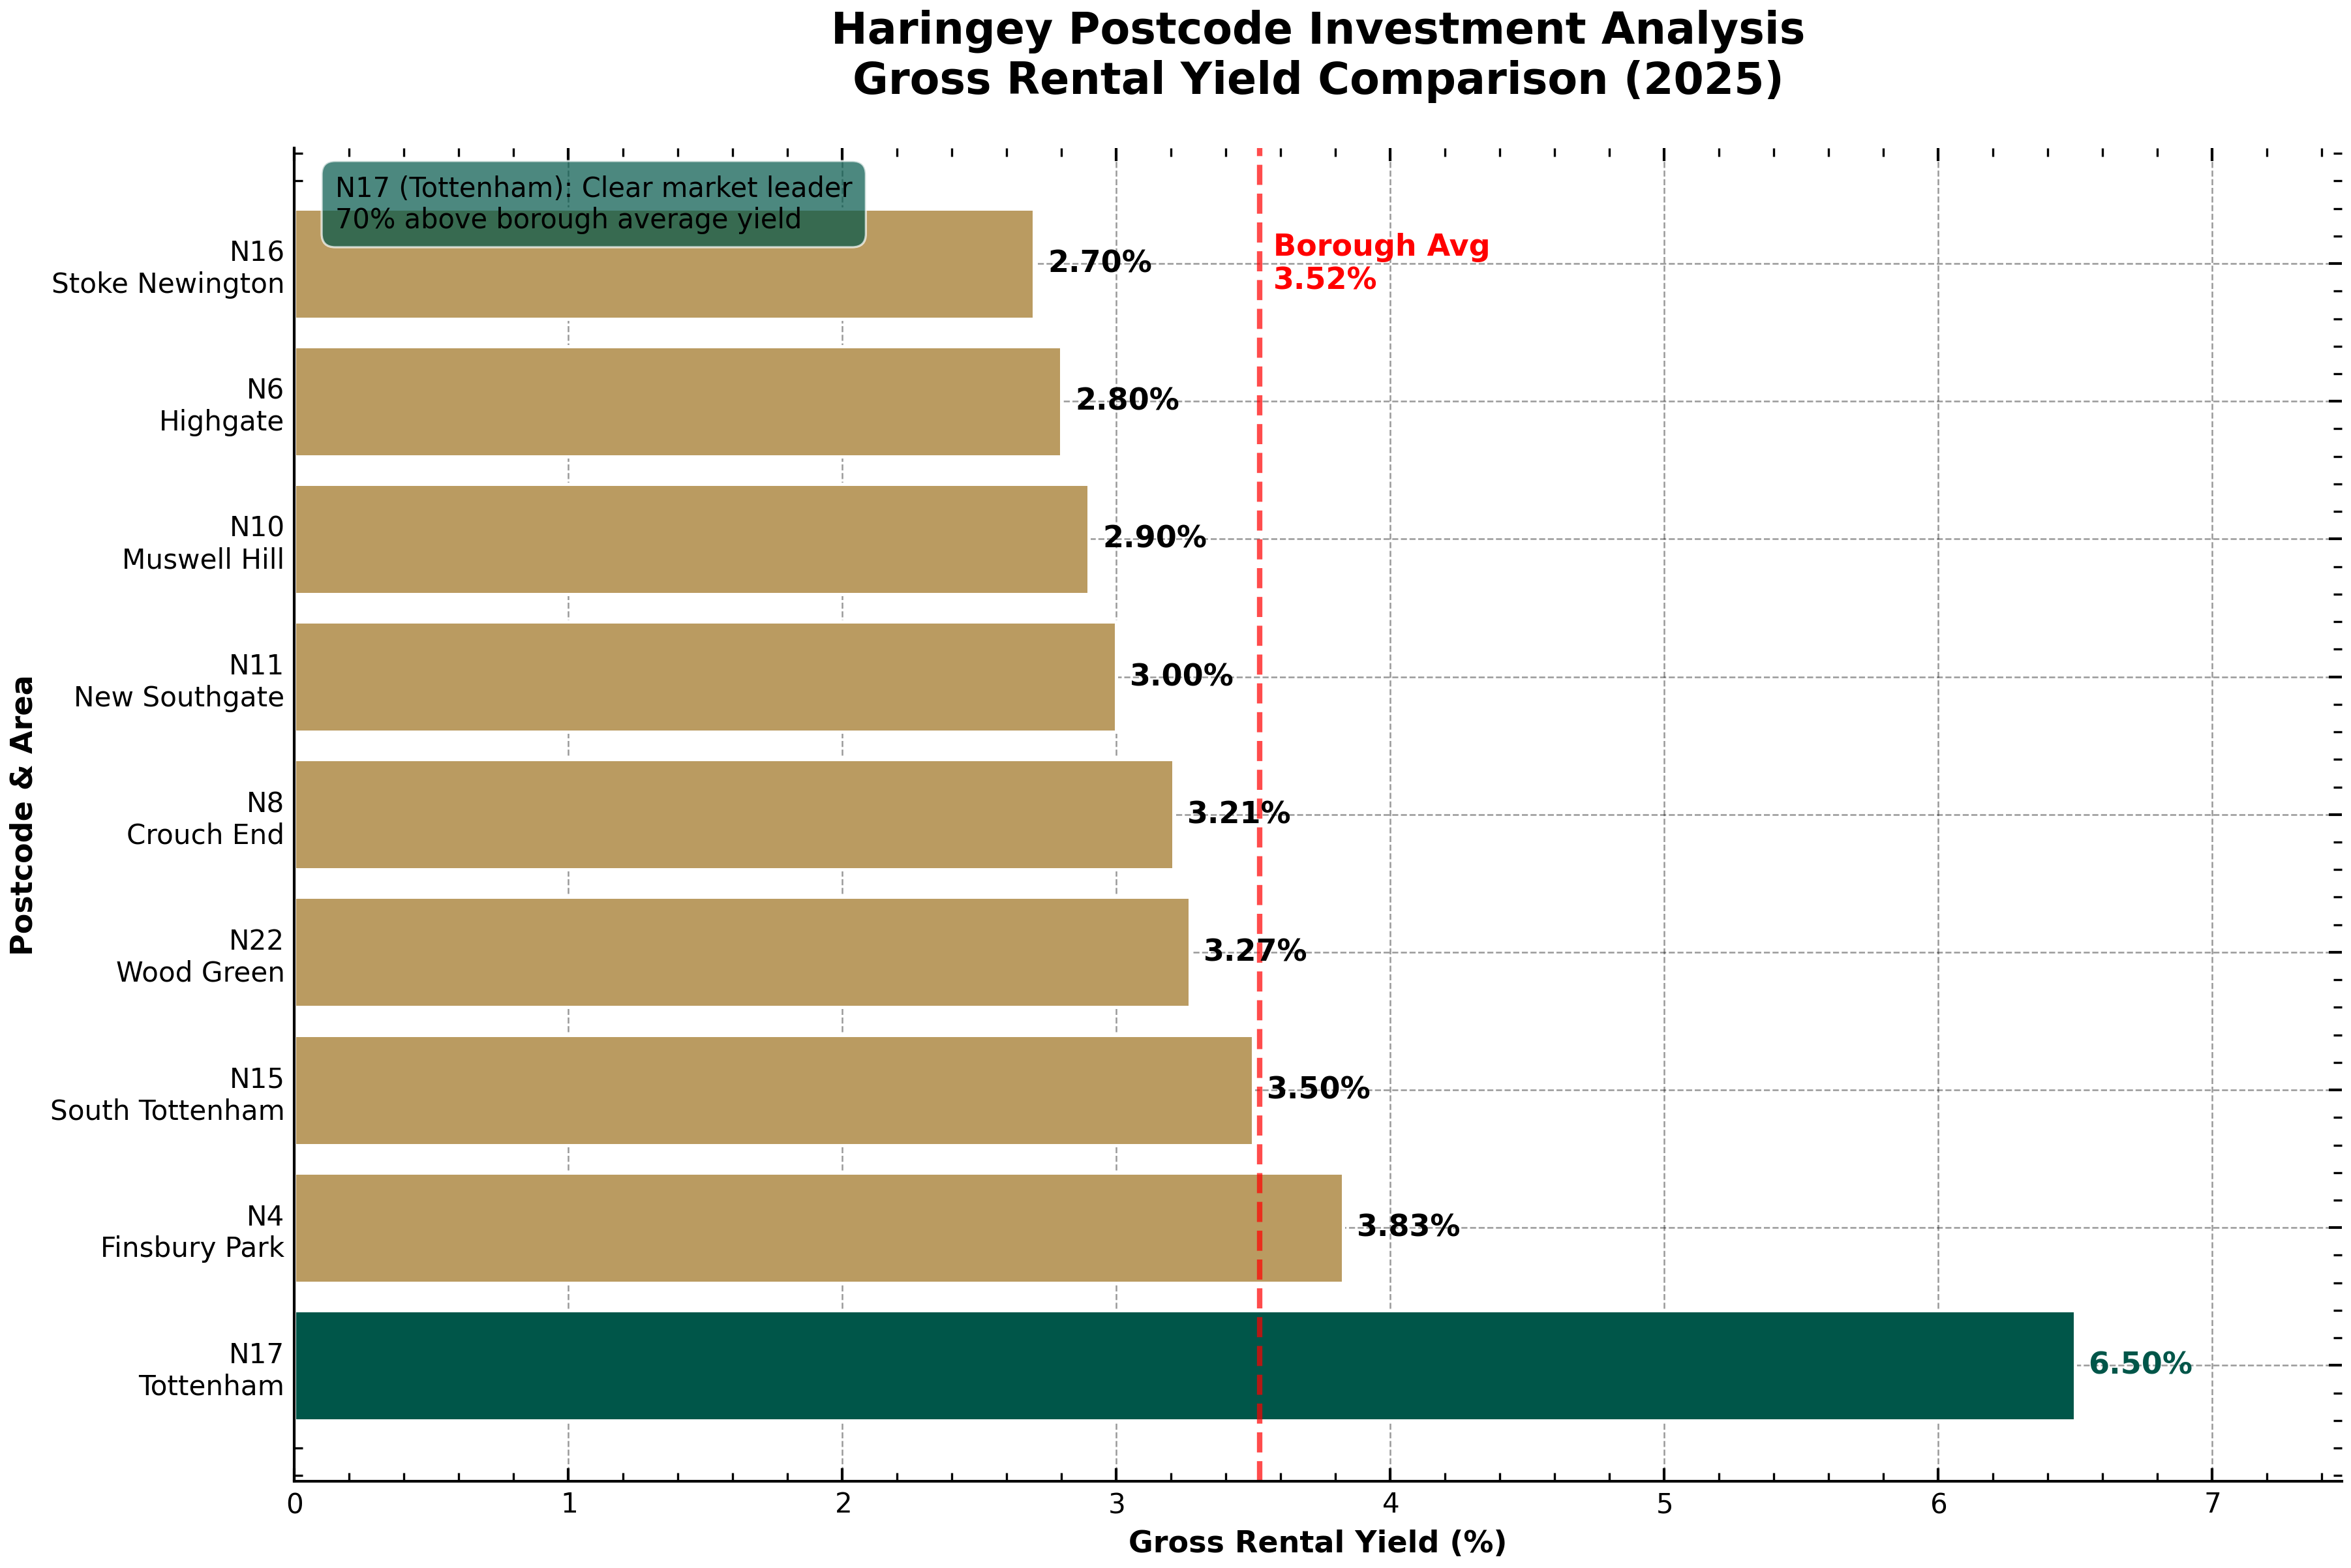 Bar chart showing gross rental yields for Haringey investment properties in 2025. N17 leads at 6.50%, well above the borough average of 3.52%. Other postcodes range from 2.70% to 3.80%. N17 is highlighted in green. Presented by Palace Auctions
Rental Yield by Postcode – N17’s 6.5% yield is the highest in Haringey.
Five-Year Capital Growth Comparison
 Bar chart comparing five-year capital growth projections (2020-2025) for various Haringey postcodes. N17 Tottenham leads at 16.9%, Crouch End N8 tops at 32%. Muswell Hill property investment opportunities highlighted in the borough average of 25.9%. Presented by Palace Auctions
Five-Year Capital Growth – N17’s growth is solid, but not the highest; its ROI is driven by yield.
Market Drivers Behind N17’s Outperformance
- Regeneration:
- Over £1 billion invested in Tottenham, including the High Road West project and Tottenham Hotspur Stadium, delivering new homes, jobs, and amenities.
- Transport Connectivity:
- Victoria Line, upgraded rail stations, and rapid access to central London boost demand and price growth.
- Affordability:
- N17’s average price (£476k) is 24% below the borough average, maximizing yield and accessibility.
- Rental Demand:
- Young, diverse population and strong employment growth drive high rental demand and low voids.
- Policy Support:
- Haringey’s Local Plan and Area Action Plan ensure coordinated, sustainable regeneration.
🏁 Conclusion
- Top ROI Postcode: N17 Tottenham (9.9% total annual ROI).
- Yield Leader: 6.5% gross rental yield (84% above borough average).
- Five-Year Growth: 16.9% (solid, but not the highest).
- Investment Edge: Affordable entry, regeneration, transport, strong rental demand.
N17 Tottenham is the definitive market leader for property investment in Haringey for 2025, offering unmatched rental yields and total ROI, underpinned by transformative regeneration and connectivity.
**For tailored investment analysis or custom dashboards, contact “Tottenham’s leading returns” by email to Palace Auctions London
Palace Auctions London: Your Gateway to Prime Property Investments in Haringey
For more information about local services and regulations, please visit the official website of the London Borough of Haringey: www.haringey.gov.uk.
London Area Investment Guides
-
City of London
Barking and Dagenham
Barnet: A Prime Investment Destination in North London
Bexley
Brent
Bromley
Camden
Croydon
Ealing
Enfield
Greenwich
Hackney: A Vibrant East London Borough with Rich Investment Potential
Hammersmith and Fulham
Harrow
Havering
Hillingdon
Hounslow
Islington
Kensington and Chelsea
Kingston upon Thames
Lambeth
Lewisham
Merton
Newham
Redbridge
Richmond upon Thames
Southwark
Sutton
Tower Hamlets
Waltham Forest
Wandsworth
Westminster