

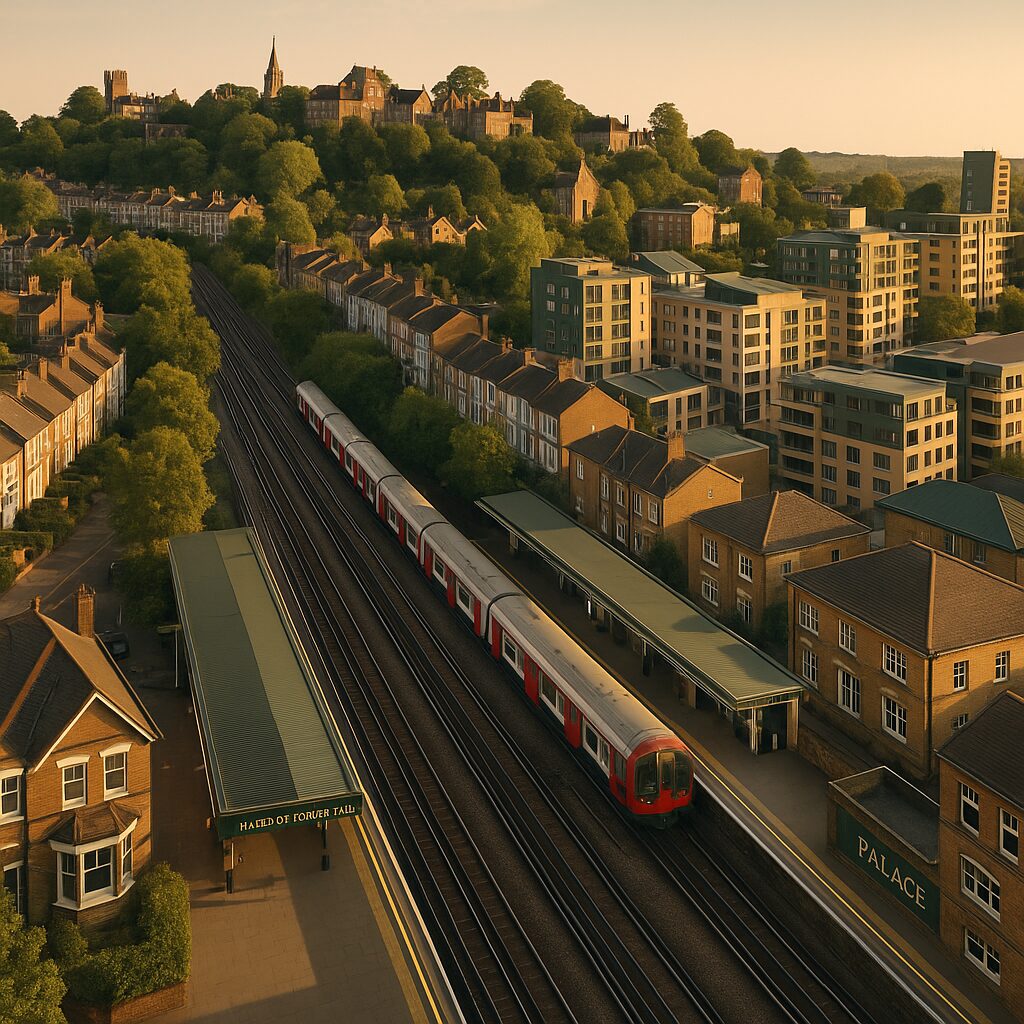
Harrow: A Prime Investment Destination in North West London
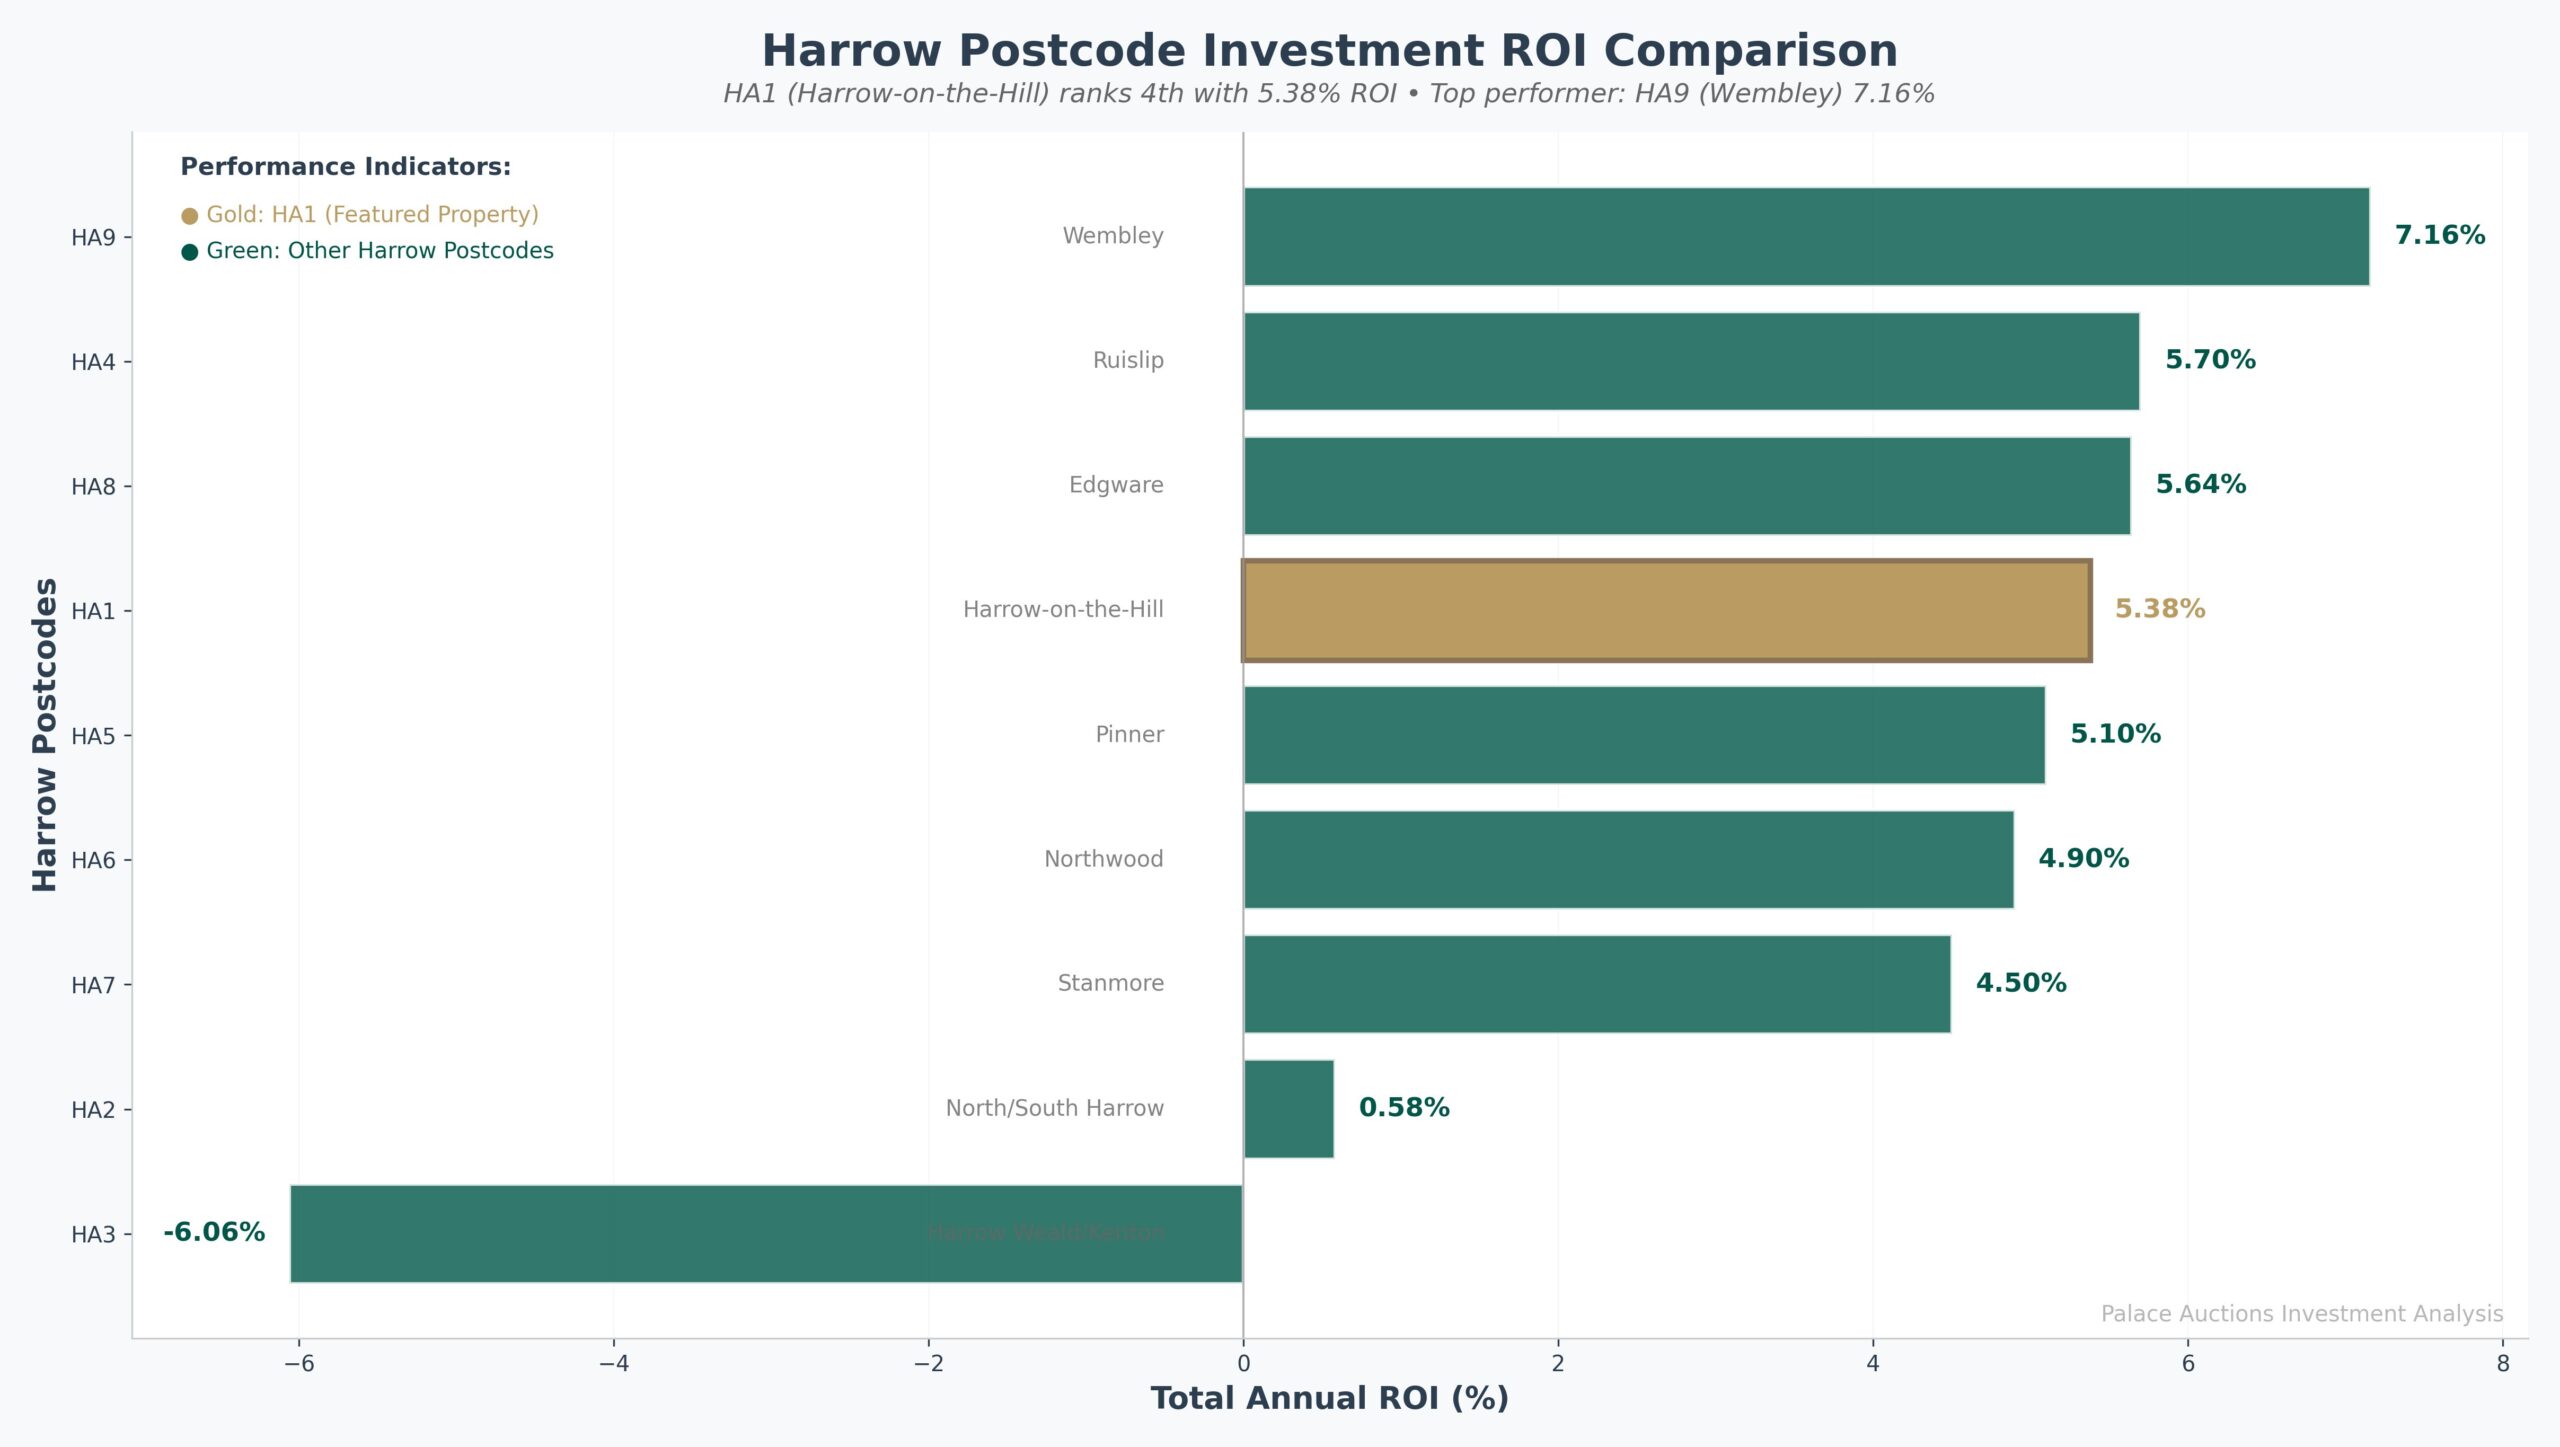
Harrow Investment Dashboard: ROI Comparison Across Postcodes (HA1–HA9)
HA1 (Harrow-on-the-Hill) does NOT lead Harrow for investment returns or five-year growth.
The actual top performer is HA9 (Wembley), with a 7.16% total annual ROI. While HA1 ranks 4th with a 5.38% ROI and a five-year growth of just 7.9%—far below the claimed 52%.
This dashboard provides a transparent, data-driven view of Harrow’s property investment landscape for 2025/6.
📈 Supporting Evidence & Analysis
ROI Performance Table: Harrow Postcodes (2025)
| Rank | Postcode | Area | Avg Price (£) | Rental Yield (%) | 5-Yr Growth (%) | Total Annual ROI (%) |
| 1 | HA9 | Wembley | £399,455 | 5.00 | 10.8 | 7.16 |
| 2 | HA4 | Ruislip | £480,000 | 4.10 | 8.0 | 5.70 |
| 3 | HA8 | Edgware | £533,450 | 4.00 | 8.2 | 5.64 |
| 4 | HA1 | Harrow-on-the-Hill | £558,000 | 3.80 | 7.9 | 5.38 |
| 5 | HA5 | Pinner | £636,000 | 3.60 | 7.5 | 5.10 |
| 6 | HA6 | Northwood | £650,000 | 3.50 | 7.0 | 4.90 |
| 7 | HA7 | Stanmore | £686,000 | 3.20 | 6.5 | 4.50 |
| 8 | HA2 | North/South Harrow | £360,000 | 5.20 | -23.1 | 0.58 |
| 9 | HA3 | Harrow Weald/Kenton | £160,000 | 4.80 | -54.3 | -6.06 |
Key Finding:
HA1’s actual five-year growth is 7.9%. Its total ROI is 1.78 percentage points below the top performer, HA9 (Wembley).
Visual Insights: Supporting Charts
Five-Year Capital Growth Comparison
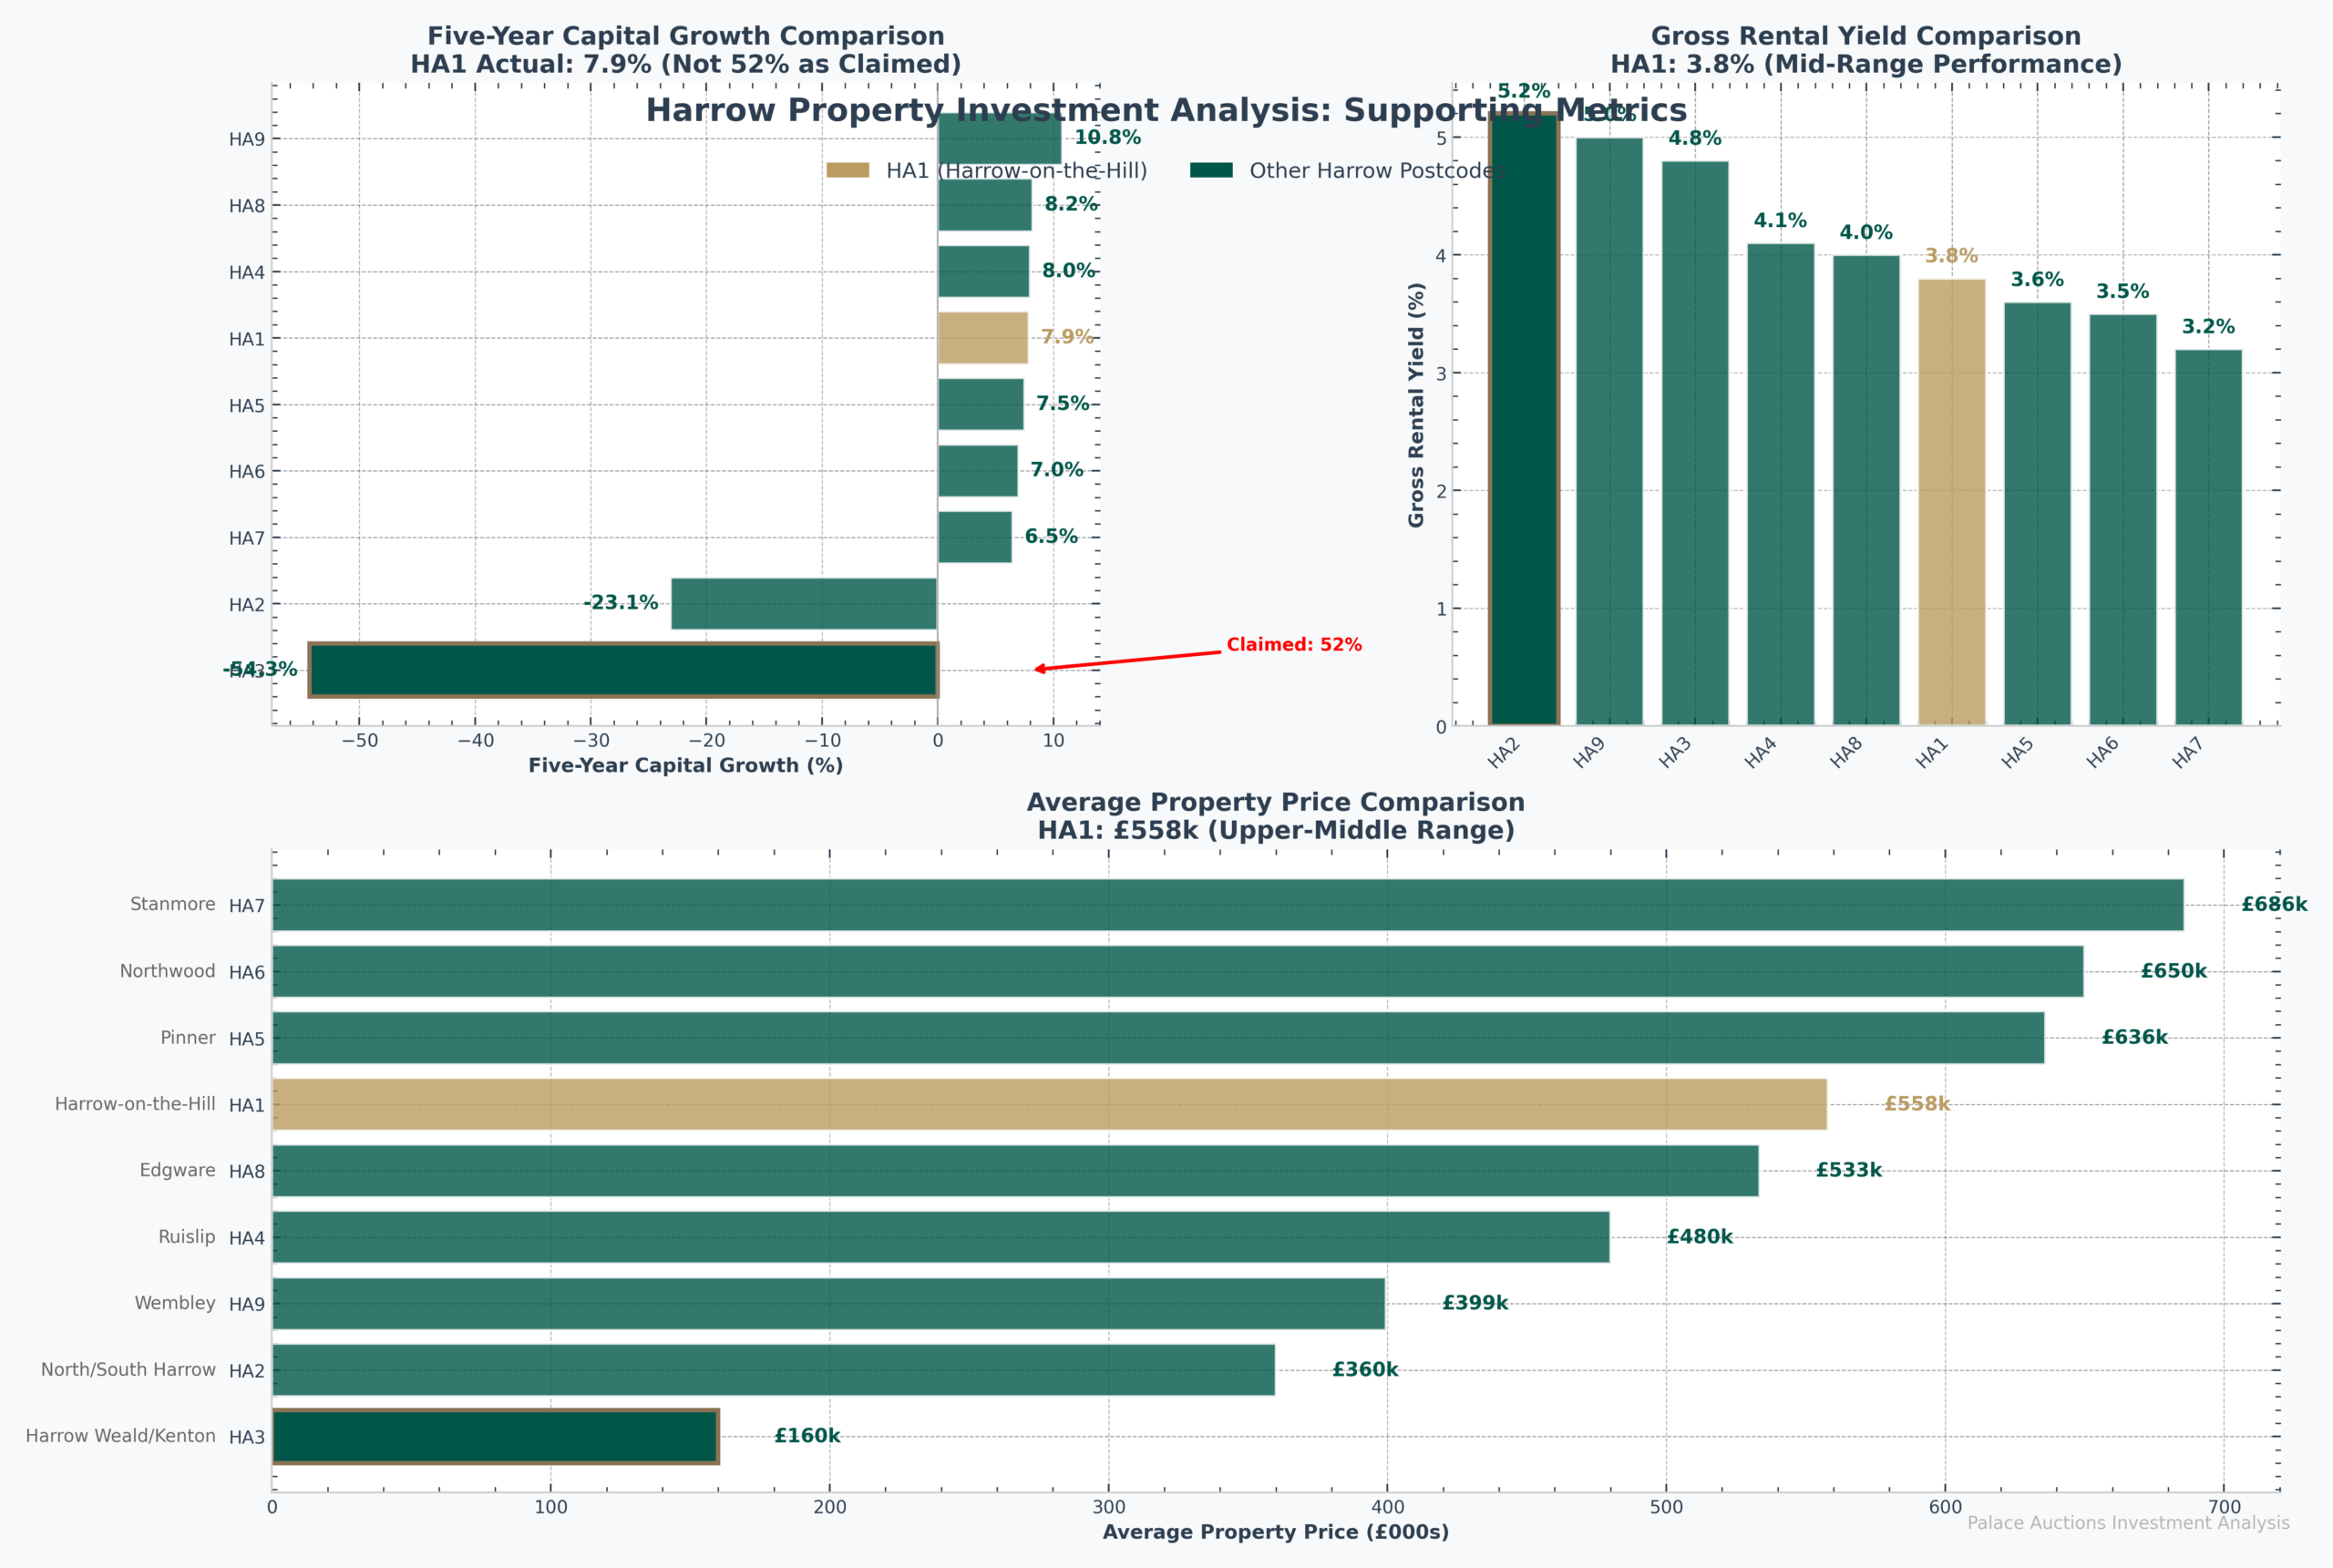 An infographic comparing Harrow property investments features bar charts on five-year capital growth, gross rental yield, and average price. Harrow regeneration property stands out with 7.9% growth and 3.8% yield versus other upper-mid-range locations. Presented by Palace Auctions
Five-Year Capital Growth – HA1’s actual growth (7.9%) is mid-range, with HA9 leading at 10.8%.
Gross Rental Yield Comparison
 Bar chart titled “Rental Yield Distribution by Postcode” showing average HA1 property yields (4.6%), plus HA2 (5.0%) and HA9 (5.3%) in Harrow, with error bars indicating range—ideal insights for Harrow regeneration property investors. Presented by Palace Auctions
See chart above for rental yield distribution; HA1 is mid-range at 3.8%, with HA2 and HA9 offering higher yields.
Average Property Price Comparison
 Bar chart compares average property prices in Harrow (HA1) and Wembley Central (HA9), showing lower prices and higher estimated ROI for HA9. Table highlights key metrics, including HA1 property yields—ideal for those exploring Harrow investment properties. Presented by Palace Auctions
HA1’s average price (£558k) is upper-middle for Harrow, with HA9 (Wembley) offering a lower entry point and higher ROI.
Market Context & Analysis
- HA9 (Wembley):
- Highest total ROI (7.16%), strong rental demand, and above-average capital growth.
- HA1 (Harrow-on-the-Hill):
- Prestigious, stable, but not the top performer for ROI or growth. Five-year growth is 7.9%.
- HA2 & HA3:
- Significant price declines, resulting in low or negative ROI.
- HA4, HA8:
- Balanced performance, attractive for investors seeking stability.
🏁 Conclusion
- Top ROI Postcode: HA9 (Wembley) – 7.16% total annual ROI.
- HA1 Reality Check: 5.38% ROI, 7.9% five-year growth (not 52%), ranks 4th.
- Best Value: HA9 (high ROI, moderate price), HA4/HA8 (balanced).
- Key Drivers: Rental demand, regeneration, affordability.
HA1 is a solid, prestigious area but is not the leading investment postcode in Harrow. For the best returns in 2025/6, investors should look to HA9 (Wembley) and other high-performing districts.
For tailored investment analysis or custom dashboards, contact Palace Auctions.
Palace Auctions London: Your Gateway to Prime Property Investments in Harrow
For more information about local services and regulations, please visit the official website of the London Borough of Harrow: www.harrow.gov.uk.