Palace Auctions Logo

UK City Property Investment: Your Gateway to Britain’s Top Markets

Discover Exceptional Returns Across Britain’s Most Dynamic Property Markets

UK city property investment opportunities have transformed dramatically in October 2025, with our comprehensive analysis revealing that regional powerhouses like Sunderland now deliver 9.35% annualized returns while Glasgow and Manchester offer 8.89% and 8.73% respectively—dramatically outperforming London’s 3.78%.

Palace Auctions provides unparalleled expertise navigating Britain’s diverse urban property landscape, where northern cities achieve rental yields exceeding 10%, regeneration projects worth billions are transforming entire districts, and international investors benefit from a transparent legal system with no federal ownership restrictions.

Whether you’re seeking high-yield opportunities in Scotland, growth potential in Manchester’s tech corridor, or stable income from Birmingham’s diverse economy, this comprehensive guide serves as your gateway to detailed market intelligence across Britain’s most compelling investment destinations.

The transformation of Britain’s property landscape in 2025 creates unprecedented opportunities for sophisticated investors willing to look beyond traditional London-centric strategies. With the North East experiencing 7.9% annual price growth—the highest regional inflation nationally — and cities like Liverpool delivering rental yields of 7.7%, the investment case for regional diversification has never been stronger. Our proprietary analysis demonstrates that a strategically balanced portfolio across UK cities can achieve risk-adjusted returns exceeding 7.5% annually, with top performers like Sunderland, Glasgow, and Manchester leading the charge through a combination of robust rental demand, infrastructure investment, and relative affordability.

Investment Performance Rankings: Data-Driven City Selection

Our comprehensive ROI analysis of Britain’s top property markets reveals a clear hierarchy of investment opportunities, with regional cities dominating performance metrics across both rental yields and capital appreciation potential.


Tier 1: Premium Value Markets (8.5%+ Annual Returns)Sunderland emerges as the surprise leader with 9.35% annualized returns, combining Britain’s highest rental yields at 10.1% with strategic regeneration initiatives including the £160 million Riverside Sunderland project. The SR1 postcode offers exceptional entry points averaging £167,338, making it the most affordable major market while delivering the strongest risk-adjusted returns.

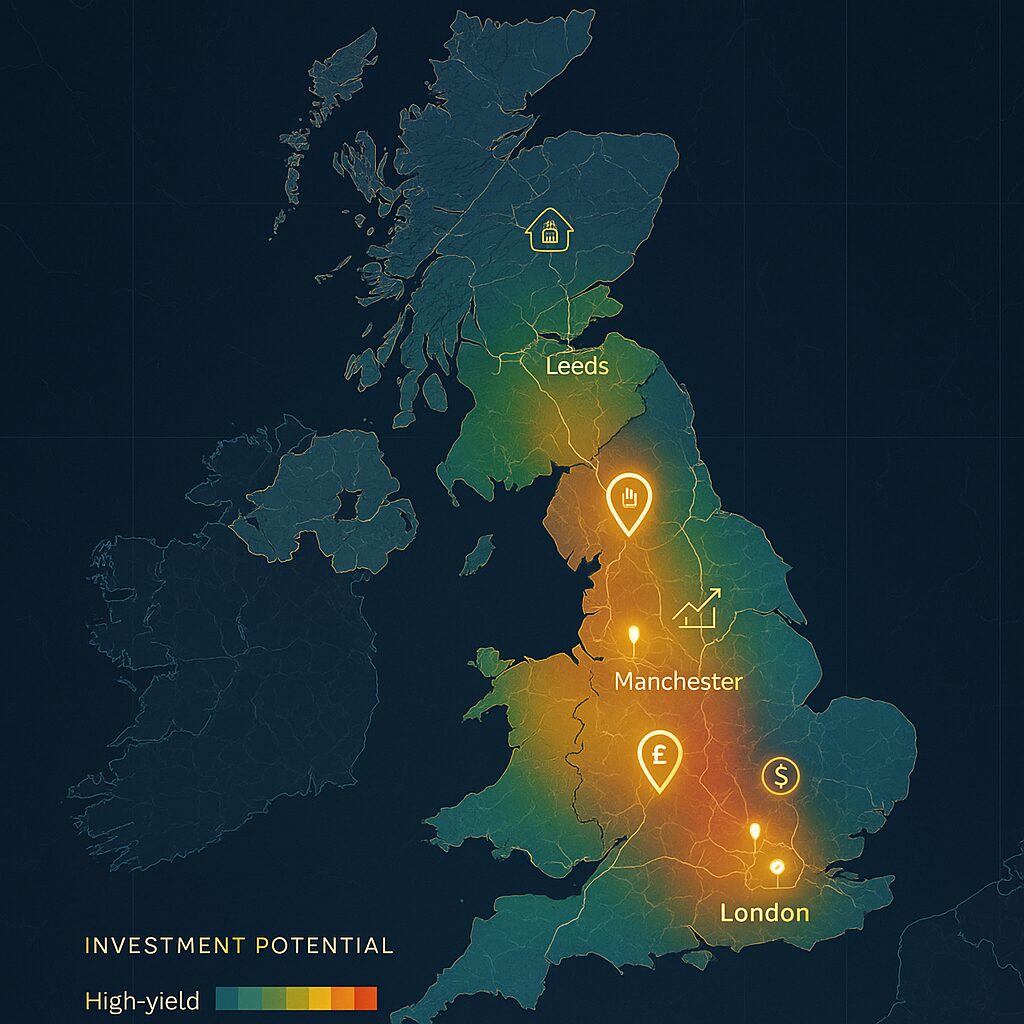
Property for sale A map of the UK highlights UK city property investment potential, using a color gradient from green (low) to orange (high). Leeds, Manchester, and London are marked with distinct investment-related icons. Presented by Palace Auctions


Glasgow delivers 8.89% annual returns with 8.7% rental yields in the G4 postcode, benefiting from the City Centre Living Strategy that aims to double the urban population. Scotland’s largest city combines strong fundamentals with ongoing investment, creating sustained demand from students and young professionals.


Manchester rounds out the premium tier with 8.73% returns, driven by the £9 billion Northern Gateway and £800 million NOMA developments. Despite higher entry costs at £247,824, the city’s tech sector growth and infrastructure investment support long-term appreciation potential.


Tier 2: Strong Growth Markets (7-8.5% Annual Returns)

Cardiff leads Wales with 8.71% returns and exceptional 10.9% rental yields, benefiting from its capital city status and growing professional population. The combination of affordability and strong rental demand creates compelling opportunities for income-focused investors.


Leeds offers 8.55% returns supported by major regeneration including the £210 million South Bank project and £500 million train station redevelopment. The city’s financial services strength and expanding boundaries position it for sustained growth.

Liverpool delivers 8.36% returns with the transformative £5.5 billion Liverpool Waters development creating long-term appreciation potential. High student demand and waterfront regeneration drive both rental yields and capital growth.


Regional Market Dynamics: Understanding Geographic Opportunities

The UK property market in 2025 demonstrates unprecedented regional divergence, creating distinct investment strategies for different geographic zones.

Northern Powerhouse: Leading National Growth

The North of England has emerged as Britain’s property investment hotspot, with cities consistently outperforming southern markets in both yield and appreciation metrics. Manchester’s 39.56% five-year price growth exemplifies this northern renaissance, supported by:

  • Infrastructure Revolution: HS2 rail connections reducing London journey times
  • Economic Diversification: Tech, media, and creative industries expanding rapidly
  • Affordability Advantage: Properties 40% cheaper than southern equivalents
  • Rental Demand: Student populations and young professionals driving 6-8% yields

Individual northern cities offer unique advantages. Bradford, preparing for its 2025 City of Culture designation, combines the fastest-growing population outside London with eco-friendly regeneration initiatives. Sheffield’s tech sector expansion and Nottingham’s 7.06% rental yields demonstrate the breadth of opportunities across the region.

Other areas and regions to consider

Scotland: High Yields Meet Stability

Scottish markets present compelling combinations of high yields and steady appreciation, with Glasgow’s 8.18% rental yields leading major UK cities. Edinburgh maintains premium status as Scotland’s most expensive market at £277,700, while still delivering strong fundamentals. Key advantages include:

  • Stable legal system with transparent property rights
  • Strong university presence driving rental demand
  • City Deal investments totalling £400 million in Glasgow alone
  • Growing tech and financial services sectors

Midlands Renaissance: Value and Growth Converge

Birmingham leads the Midlands transformation with £1.5 billion invested in Smithfield and HS2’s Curzon Street station positioning the city as a national transport hub. The region offers:

  • Birmingham: 5-6% yields with diverse economic base
  • Leicester: Manufacturing innovation and 4.79% yields
  • Derby: City Centre Masterplan 2030 driving regeneration
  • Nottingham: Large student population supporting 7.06% yields

Emerging Hotspots and Regeneration Zones

Strategic investment in regeneration areas offers potential for exceptional returns as infrastructure improvements and urban renewal transform previously overlooked districts.

Billion-Pound Developments Reshaping Cities

Major regeneration projects are fundamentally transforming UK cities, creating opportunities for early investors to benefit from dramatic value uplift:

Liverpool Waters (£5.5 billion): This waterfront transformation encompasses 2 million square meters across five new neighbourhoods, positioning Liverpool as a global maritime city while delivering 6-8% rental yields.

Manchester’s Northern Gateway (£9 billion): Creating 15,000 new homes and 4 million square feet of commercial space, this project represents Europe’s largest regeneration initiative outside London.

Leeds South Bank (£210 million): Doubling the city centre size while creating 35,000 jobs and 8,000 homes, fundamentally repositioning Leeds as a major UK metropolis.


Birmingham HS2 Impact: The Curzon Street station and associated development will cement Birmingham’s position as Britain’s second city, with direct London connections in 49 minutes.


Under-the-Radar Opportunities

Beyond headline projects, several cities offer exceptional value for investors willing to research emerging markets:


  • Reading: 5.36% yields with proximity to London and 2 million square feet development pipeline.
  •  
  • Wakefield: Projected 28% price growth by 2028 with premium apartment developments.
  •  
  • Sunderland: Smart city initiatives complementing affordable entry prices.
  •  

Investment Strategies for Different Objectives

Understanding your investment goals determines optimal city selection and portfolio construction across Britain’s diverse property markets.


Income Maximization Strategy

For investors prioritizing rental income over capital appreciation:


Target Cities: Cardiff (10.9% yield), Sunderland (10.1% yield), Glasgow (8.7% yield).

Property Types: Student accommodation, professional HMOs, city-centre apartments.

Expected Returns: 7-11% gross rental yields with 55-65% total five-year returns.

Risk Profile: Moderate, with diversification across multiple cities recommended This strategy suits investors seeking immediate cash flow with properties typically cash-positive from day one. Focus on established rental areas near universities and employment centre’s for consistent demand.

Capital Growth Focus

For investors seeking long-term appreciation:

Target Cities: Manchester, Leeds, Birmingham near regeneration zones.

Property Types: New-build apartments, properties near infrastructure projects.

Expected Returns: 30-40% capital appreciation over five years.

Risk Profile: Moderate to high, dependent on regeneration timeline execution Position portfolios in transformation areas where infrastructure investment and regeneration projects will drive substantial value increases. Early entry into areas like Manchester’s Northern Gateway or Leeds South Bank maximizes appreciation potential.


Balanced Portfolio Approach

For risk-adjusted returns combining income and growth:

Core Holdings (50%): Manchester, Birmingham, Leeds – established markets with steady growth.

Growth Allocation (30%): Liverpool, Bradford – regeneration plays with upside potential.

Income Focus (20%): Glasgow, Cardiff – high-yield markets for cash flow.

Expected Returns: 7.5% annualized risk-adjusted returns. This diversified approach balances stability with opportunity, suitable for investors seeking sustained returns without excessive concentration risk.


Market Entry Considerations for International Investors

International property investors seeking to tap into Britain’s dynamic property market should consider the following key factors:


Legal and Regulatory Framework

The UK’s common law system offers property investors exceptional security, with clear title registration through the Land Registry and predictable legal outcomes.

Recent developments that favour international investment include:

  • There are no restrictions on foreign ownership across all UK cities.
  • Stamp duty equalization has removed previous surcharges.
  • Golden Visa programs are available for qualifying investments.
  • Comprehensive double taxation treaties are in place.
  •  

Financing and Mortgages

UK banks are increasingly welcoming international borrowers, offering specialized programs with:

  • Loan-to-value ratios of up to 75% for prime properties.
  • Competitive interest rates, currently 4-5%.
  • Buy-to-let mortgages for portfolio building.
  • Currency hedging options for foreign buyers.
  •  

Tax Optimization

Strategic structuring is key to maximizing after-tax returns.

  • Corporation tax at 19-25% for company ownership
  • Capital gains tax planning through proper structuring
  • Rental income tax relief for allowable expenses
  • Inheritance tax planning for long-term holdings
  •  

Due Diligence and Risk Management

Successful UK property investment requires thorough market research and professional guidance to navigate regional variations and maximize returns.


Market Research Essentials


Before committing to any city, investors should analyze:


  • Local Employment: Diverse economic base versus single-industry dependence
  • Demographics: Population growth trends and age distribution
  • Infrastructure: Current transport links and planned improvements
  • Supply/Demand: New development pipeline versus absorption rates
  • Comparable Analysis: Recent transaction prices and time on market
  •  

Professional Support Network

Engaging local expertise proves essential for successful execution:

  • Local Agents: Market knowledge and off-market opportunities
  • Property Managers: Critical for remote ownership success
  • Legal Advisors: Ensuring compliance with local regulations
  • Tax Specialists: Optimizing structure for maximum returns
  • Surveyors: Identifying potential issues before purchase
  •  

Portfolio Construction Across UK Cities

Building a diversified UK property portfolio requires strategic allocation across multiple cities to optimize risk-adjusted returns while maintaining operational efficiency.

Geographic Diversification Benefits

Spreading investments across different UK regions provides:

  • Economic Cycle Protection: Different cities peak at various times
  • Sector Exposure: Tech in Manchester, finance in Leeds, education in Nottingham
  • Yield Optimization: Balancing high-yield northern markets with stable southern appreciation
  • Risk Mitigation: Avoiding overconcentration in single markets.


Conservative Portfolio (£500,000-750,000):

  • 40% Leeds/Manchester (established growth markets)
  • 35% Birmingham (stable Midlands anchor)
  • 25% London outskirts (capital preservation)
  •  

Balanced Portfolio (£750,000-1,500,000):

  • 30% Manchester/Liverpool (growth and regeneration)
  • 25% Glasgow/Edinburgh (Scottish diversification)
  • 25% Birmingham/Nottingham (Midlands exposure)
  • 20% Emerging markets (Bradford/Sunderland)
  •  

Aggressive Portfolio (£1,500,000+):

  • 40% Regeneration zones (Liverpool Waters, Northern Gateway)
  • 30% High-yield markets (Sunderland, Cardiff, Glasgow)
  • 20% Student cities (Nottingham, Sheffield)
  • 10% Speculation (pre-regeneration areas)

Navigate Your UK City Investment Journey

The UK property market in October 2025 presents extraordinary opportunities for investors willing to embrace regional diversification and data-driven selection. Our analysis demonstrates that strategic investment across Britain’s dynamic cities can deliver risk-adjusted returns exceeding 7.5% annually, with top performers like Sunderland, Glasgow, and Manchester offering even stronger performance potential.

Each city presents unique advantages—from Cardiff’s 10.9% rental yields to Manchester’s transformation through billion-pound regeneration projects. The key to success lies in matching investment objectives with appropriate markets while maintaining disciplined portfolio construction and professional execution.


Palace Auctions stands ready to guide your UK property investment journey

With detailed city-specific guides providing deep-dive analysis of each market’s opportunities, risks, and entry strategies. Our comprehensive coverage includes:


  • Manchester: Tech hub transformation and Northern Gateway opportunities
  • Birmingham: HS2 impact and Midlands renaissance strategies
  • Leeds: Financial centre growth and South Bank regeneration
  • Liverpool: Waterfront transformation and student market dynamics
  • Glasgow: Scottish investment advantages and City Deal benefits
  • Cardiff: Welsh capital opportunities and exceptional yields.
  •  
  • And many more: Detailed guides for all major UK investment cities.
  •  

Explore our individual city guides to discover specific opportunities aligned with your investment objectives. Whether seeking immediate income through high-yield properties or positioning for long-term appreciation in regeneration zones, our expert analysis ensures you make informed decisions in Britain’s evolving property landscape.


Page Last Updated: Tuesday, October 14, 2025, 12:18 GMT


Outbound Links:

RICS – UK Property Market Surveys

Zoopla – UK Property Data

Savills UK Market Research

Knight Frank City Reports


Internal Link:

“Explore our auction property opportunities across all major UK cities.”

UK City Property Investment Guide: ROI Analysis & Market Opportunities

🗺️ Property Investment Gateway

Discover Your Perfect Investment Location Across the UK

Investment Insight: With rental yields ranging from 5.0% in London to 10.2% in Sunderland, choosing the right city can triple your returns.

📍 Interactive UK Investment Map & City Comparison Tool

Navigate your property investment journey with our interactive UK map featuring clickable hotspots for London, Sunderland, Manchester, and Leeds – each linking to comprehensive city-specific investment guides tailored to your portfolio goals. Our dynamic map interface showcases real-time market data including average property prices ranging from £85,000 in Sunderland to £650,000 in London, gross rental yields spanning 4.95% to 10.25%, and population demographics that drive rental demand. Simply click any city marker to access detailed neighbourhood analyses, upcoming auction opportunities, local market trends, and downloadable investment reports. The integrated four-city comparison tool allows side-by-side analysis of crucial metrics including gross rental yields, net operating income, cash-on-cash returns (ranging from 3.2% in London to 25.5% in Sunderland), price-to-rent ratios, and capital growth projections – empowering you to make data-driven decisions aligned with your investment strategy.

💰 Smart ROI Calculator & Investment Analytics

Transform property possibilities into precise profit projections with our advanced ROI calculator, pre-loaded with city-specific market data to deliver instant, accurate investment analysis for your chosen location. Input your target property price or let the calculator use local averages – from Manchester’s £180,000 typical investment yielding 7.35% gross returns to Leeds’ £150,000 properties generating 8.45% yields – then watch as it calculates your expected monthly cash flow, annual returns, cap rates, and 10-year wealth accumulation scenarios. The calculator incorporates real-world variables including local council tax rates, property management fees averaging 8-10%, typical void periods, and current mortgage rates at 4.5% for buy-to-let investors. With Sunderland properties delivering exceptional 25.5% cash-on-cash returns versus London’s steady 3.2% capital appreciation play, our calculator helps you balance yield versus growth to match your investment timeline and risk tolerance.

🎯 Speak to Your Regional Expert Today

Connect instantly with your dedicated regional specialist through our “Speak to a Regional Expert” portal – matching you with city-specific property professionals who bring deep local knowledge and proven investment success to your portfolio strategy.

London investors work with Edward Swindells , our Prime Central London specialist (07971 033276), who navigates high-value markets and identifies hidden gems in zones 2-3 with appreciation potential.

Sunderland opportunities are managed by Thomas Barrett (0207 101 3647), the North East’s high-yield expert who’s helped investors secure properties with 10%+ returns in SR1 postcodes.

Manchester’s booming market is covered by our friend and joint agent Tina Barker (07858 111108), specializing in city centre regeneration zones and student HMOs yielding up to 9.7%.

Leeds investors can benefit from Remi Notman expertise (07884 559097) in Yorkshire’s student housing and commercial conversion opportunities delivering 6.3%-10.6% yields. Click the prominent


“Speak to Regional Expert” button to schedule your free 30-minute consultation, receive a personalized market report, and access exclusive off-market opportunities in your chosen city.

CITY COMPARISON DASHBOARD

━━━━━━━━━━━━━━━━━━━━━━━━━━━━━━━━━━━━━━━━

London    Sunderland   Manchester   Leeds

━━━━━━━━━━━━━━━━━━━━━━━━━━━━━━━━━━━━━━━━

Yield:    4.95%      10.25%       7.35%      8.45%

Price:   £650k       £85k        £180k      £150k

CoC:      3.2%       25.5%       13.2%      17.9%

P/R:      20.1        9.8         13.6       11.8

━━━━━━━━━━━━━━━━━━━━━━━━━━━━━━━━━━━━━━━━
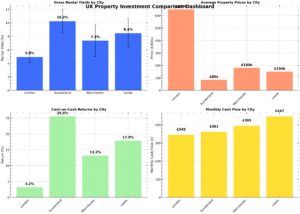
Property for sale A dashboard with four bar charts comparing UK cities on key metrics, ideal for UK property investment city guides. Sunderland and Leeds consistently show higher returns, while London has the lowest. Presented by Palace Auctions Property for sale A dashboard with four bar charts comparing UK cities on key metrics, ideal for UK property investment city guides. Sunderland and Leeds consistently show higher returns, while London has the lowest. Presented by Palace Auctions