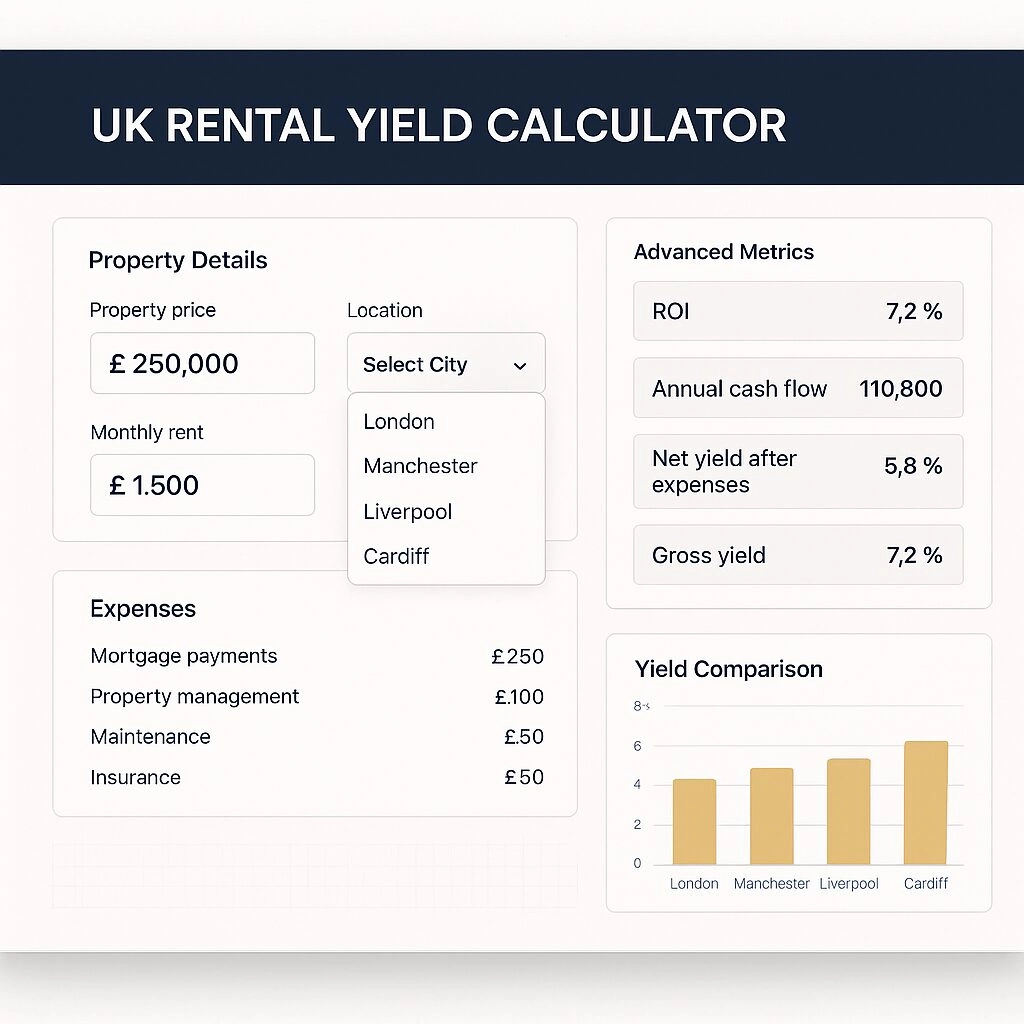

Key Investment Insight: With rental yields ranging from 3.5% in London to 10.9% in Cardiff city centre, choosing the right UK city can triple your property investment returns.
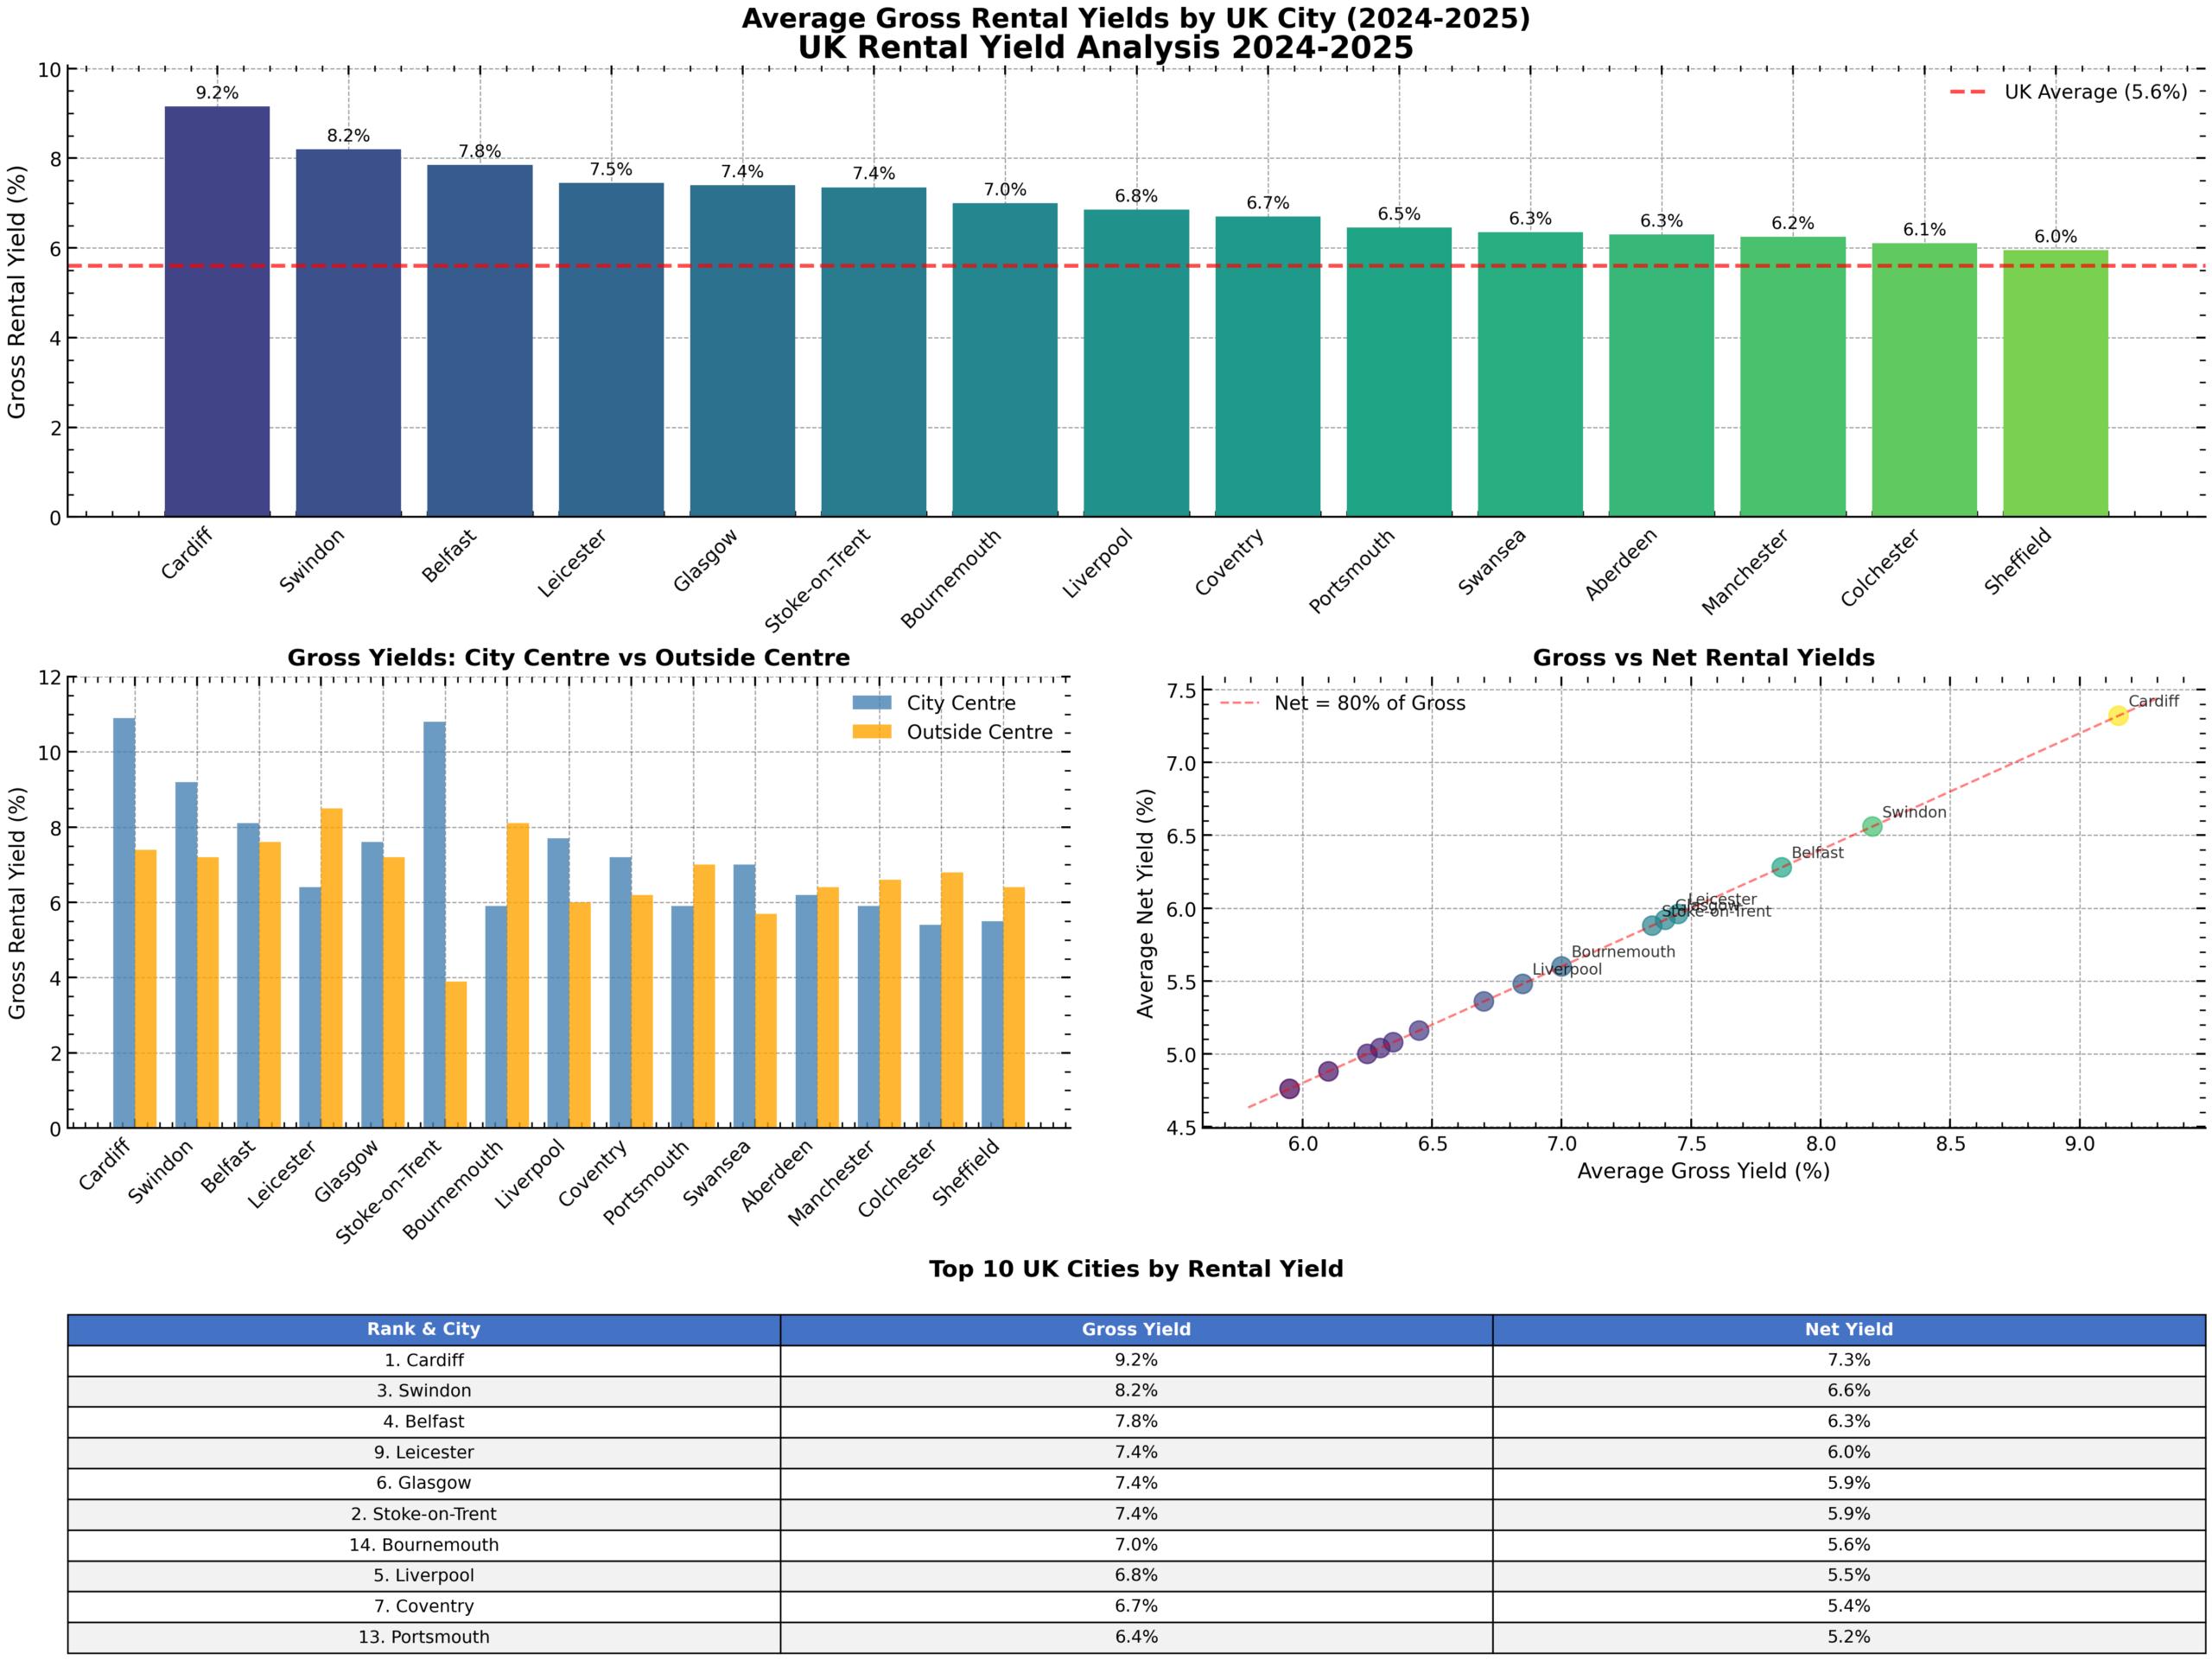
Rental yield comparisons by UK city reveal dramatic variations in investment potential, with northern and Welsh cities consistently outperforming London and the South East despite lower capital appreciation rates. The comprehensive data below showcases gross rental yields for major UK investment destinations, comparing city centre properties against suburban locations to help investors identify optimal opportunities. With the UK average gross rental yield at 5.6%, savvy investors are increasingly targeting high-yield cities like Cardiff, Sunderland, and Liverpool where returns exceed 7-10% while maintaining strong tenant demand. Understanding these regional variations is crucial for portfolio optimization, whether you’re seeking immediate cash flow through northern properties or long-term capital growth in southern markets.
Top UK Cities Ranked by Average Gross Rental Yield (2024-2025)
| Rank | City | Gross Yield (City Centre) | Gross Yield (Outside Centre) | Average Gross Yield | Net Yield (After Expenses) | Investment Profile |
| 1 | Cardiff | 10.9% | 7.4% | 9.2% | 7.3% | Student hub, capital city premium |
| 2 | Sunderland | 8.5% | 8.2% | 8.4% | 6.7% | Affordable entry, high returns |
| 3 | Burnley | 8.4% | 8.3% | 8.4% | 6.7% | Low prices, Manchester proximity |
| 4 | Swindon | 9.2% | 7.2% | 8.2% | 6.6% | Consistent yields, tech sector growth |
| 5 | Belfast | 8.1% | 7.6% | 7.8% | 6.3% | Strong growth, rising demand |
| 6 | Middlesbrough | 8.5% | 7.0% | 7.8% | 6.2% | Regeneration opportunities |
| 7 | Liverpool | 7.7% | 6.0% | 6.8% | 5.5% | Student market, cultural hub |
| 8 | Glasgow | 7.6% | 7.2% | 7.4% | 5.9% | Scotland’s largest city |
| 9 | Leicester | 6.4% | 8.5% | 7.4% | 6.0% | Strong suburban yields |
| 10 | Stoke-on-Trent | 10.8% | 3.9% | 7.4% | 5.9% | City centre focus required |
| 11 | Nottingham | 7.1% | 7.0% | 7.0% | 5.6% | Two universities, central location |
| 12 | Hull | 7.3% | 6.8% | 7.0% | 5.6% | Affordable, improving infrastructure |
| 13 | Bournemouth | 5.9% | 8.1% | 7.0% | 5.6% | Coastal premium, student growth |
| 14 | Coventry | 7.2% | 6.2% | 6.7% | 5.4% | University city, HS2 benefits |
| 15 | Leeds | 6.7% | 6.3% | 6.5% | 5.2% | Financial centre, limited supply |
| 16 | Portsmouth | 5.9% | 7.0% | 6.4% | 5.2% | Naval city, university presence |
| 17 | Manchester | 5.9% | 6.6% | 6.2% | 5.0% | Economic powerhouse |
| 18 | Birmingham | 5.4% | 5.4% | 5.4% | 4.3% | UK’s second city, HS2 hub |
| 19 | Bristol | 5.4% | 4.5% | 5.0% | 4.0% | Tech hub, high prices |
| 20 | London | 3.5–5.0% | 3.0–4.5% | 4.0% | 3.2% | Capital appreciation focus |
| Net yields calculated assuming 20% operating expenses (maintenance, management, void periods, insurance) |
High-Yield Cities (7%+ Gross Returns)
Cities achieving exceptional yields above 7% share common characteristics that smart investors exploit for maximum returns. Cardiff leads the pack at 10.9% city centre yields, driven by its capital city status and massive student population from three universities. Northern powerhouses like Liverpool (7.7%) and Glasgow (7.6%) combine affordable entry prices with robust rental demand from students and young professionals. The standout opportunity remains Sunderland at 8.5%, where investors benefit from proximity to Newcastle’s economic growth while securing properties at fraction of southern prices.
Moderate-Yield Cities (5-7% Gross Returns)
The sweet spot for balanced investors lies in cities offering 5-7% yields with stronger capital growth potential. Manchester’s 5.9% city centre yield may appear modest, but the city’s tech boom and MediaCityUK development promise sustained appreciation. Leeds at 6.7% benefits from limited housing supply and strong financial sector employment, creating rental market stability. Birmingham’s consistent 5.4% reflects its status as the UK’s second city, with HS2 arrival expected to boost both yields and values through 2030.
Understanding Gross vs Net Yields
Gross Rental Yield provides the headline return figure before expenses:
text
Gross Yield = (Annual Rental Income ÷ Property Value) × 100
Net Rental Yield delivers the realistic return after all operating costs:
text
Net Yield = ((Annual Rent – Annual Expenses) ÷ Property Value) × 100
Typical annual expenses include property management (8-10%), maintenance (5%), insurance (2%), void periods (5%), totaling approximately 20% of rental income.
Northern England & Scotland: Cash Flow Champions
Northern cities dominate the high-yield rankings, with Sunderland, Burnley, and Liverpool offering immediate positive cash flow for buy-to-let investors. These markets suit investors prioritizing rental income over capital appreciation, with typical properties priced £85,000-£150,000 generating £700-£1,200 monthly rents.
Midlands: Balanced Growth Markets
Cities like Birmingham, Coventry, and Leicester provide the optimal balance between yield (5.4-7.2%) and growth potential. Major infrastructure projects including HS2 and city centre regeneration schemes position these markets for sustained appreciation while maintaining healthy rental returns.
London & South East: Appreciation Play
While London’s 3.5-5% yields appear modest, the capital’s long-term appreciation averaging 5-7% annually creates wealth through equity growth rather than cash flow
. Investors here typically require larger deposits (25-40%) and focus on prime locations with exceptional transport links.
The UK rental market continues evolving with student cities consistently outperforming, particularly those with multiple universities like Cardiff, Nottingham, and Liverpool. Infrastructure investment remains the key driver, with HS2 beneficiary cities expected to see yield compression as values rise faster than rents through 2027
.Top Investment Strategies by City Type:
Property Type Considerations
Different property types within the same city can vary yields by 2-3 percentage points. City centre apartments typically outperform suburban houses in student cities, while family homes in commuter towns often provide more stable, long-term returns. Purpose-built student accommodation (PBSA) in cities like Nottingham and Cardiff can achieve 8-10% net yields with professional management.
Financing Impact on Returns
With current buy-to-let mortgage rates at 4.5-5.5%, cities yielding below 6% may struggle to generate positive cash flow for leveraged investors. Cash buyers benefit most from high-yield northern markets, while southern investors often rely on capital appreciation to offset lower rental returns.
Page last updated: Sunday, 19 October 2025, 06:50 GMT
Enter your email address and we will send you a link to change your password.